
Figure 1.
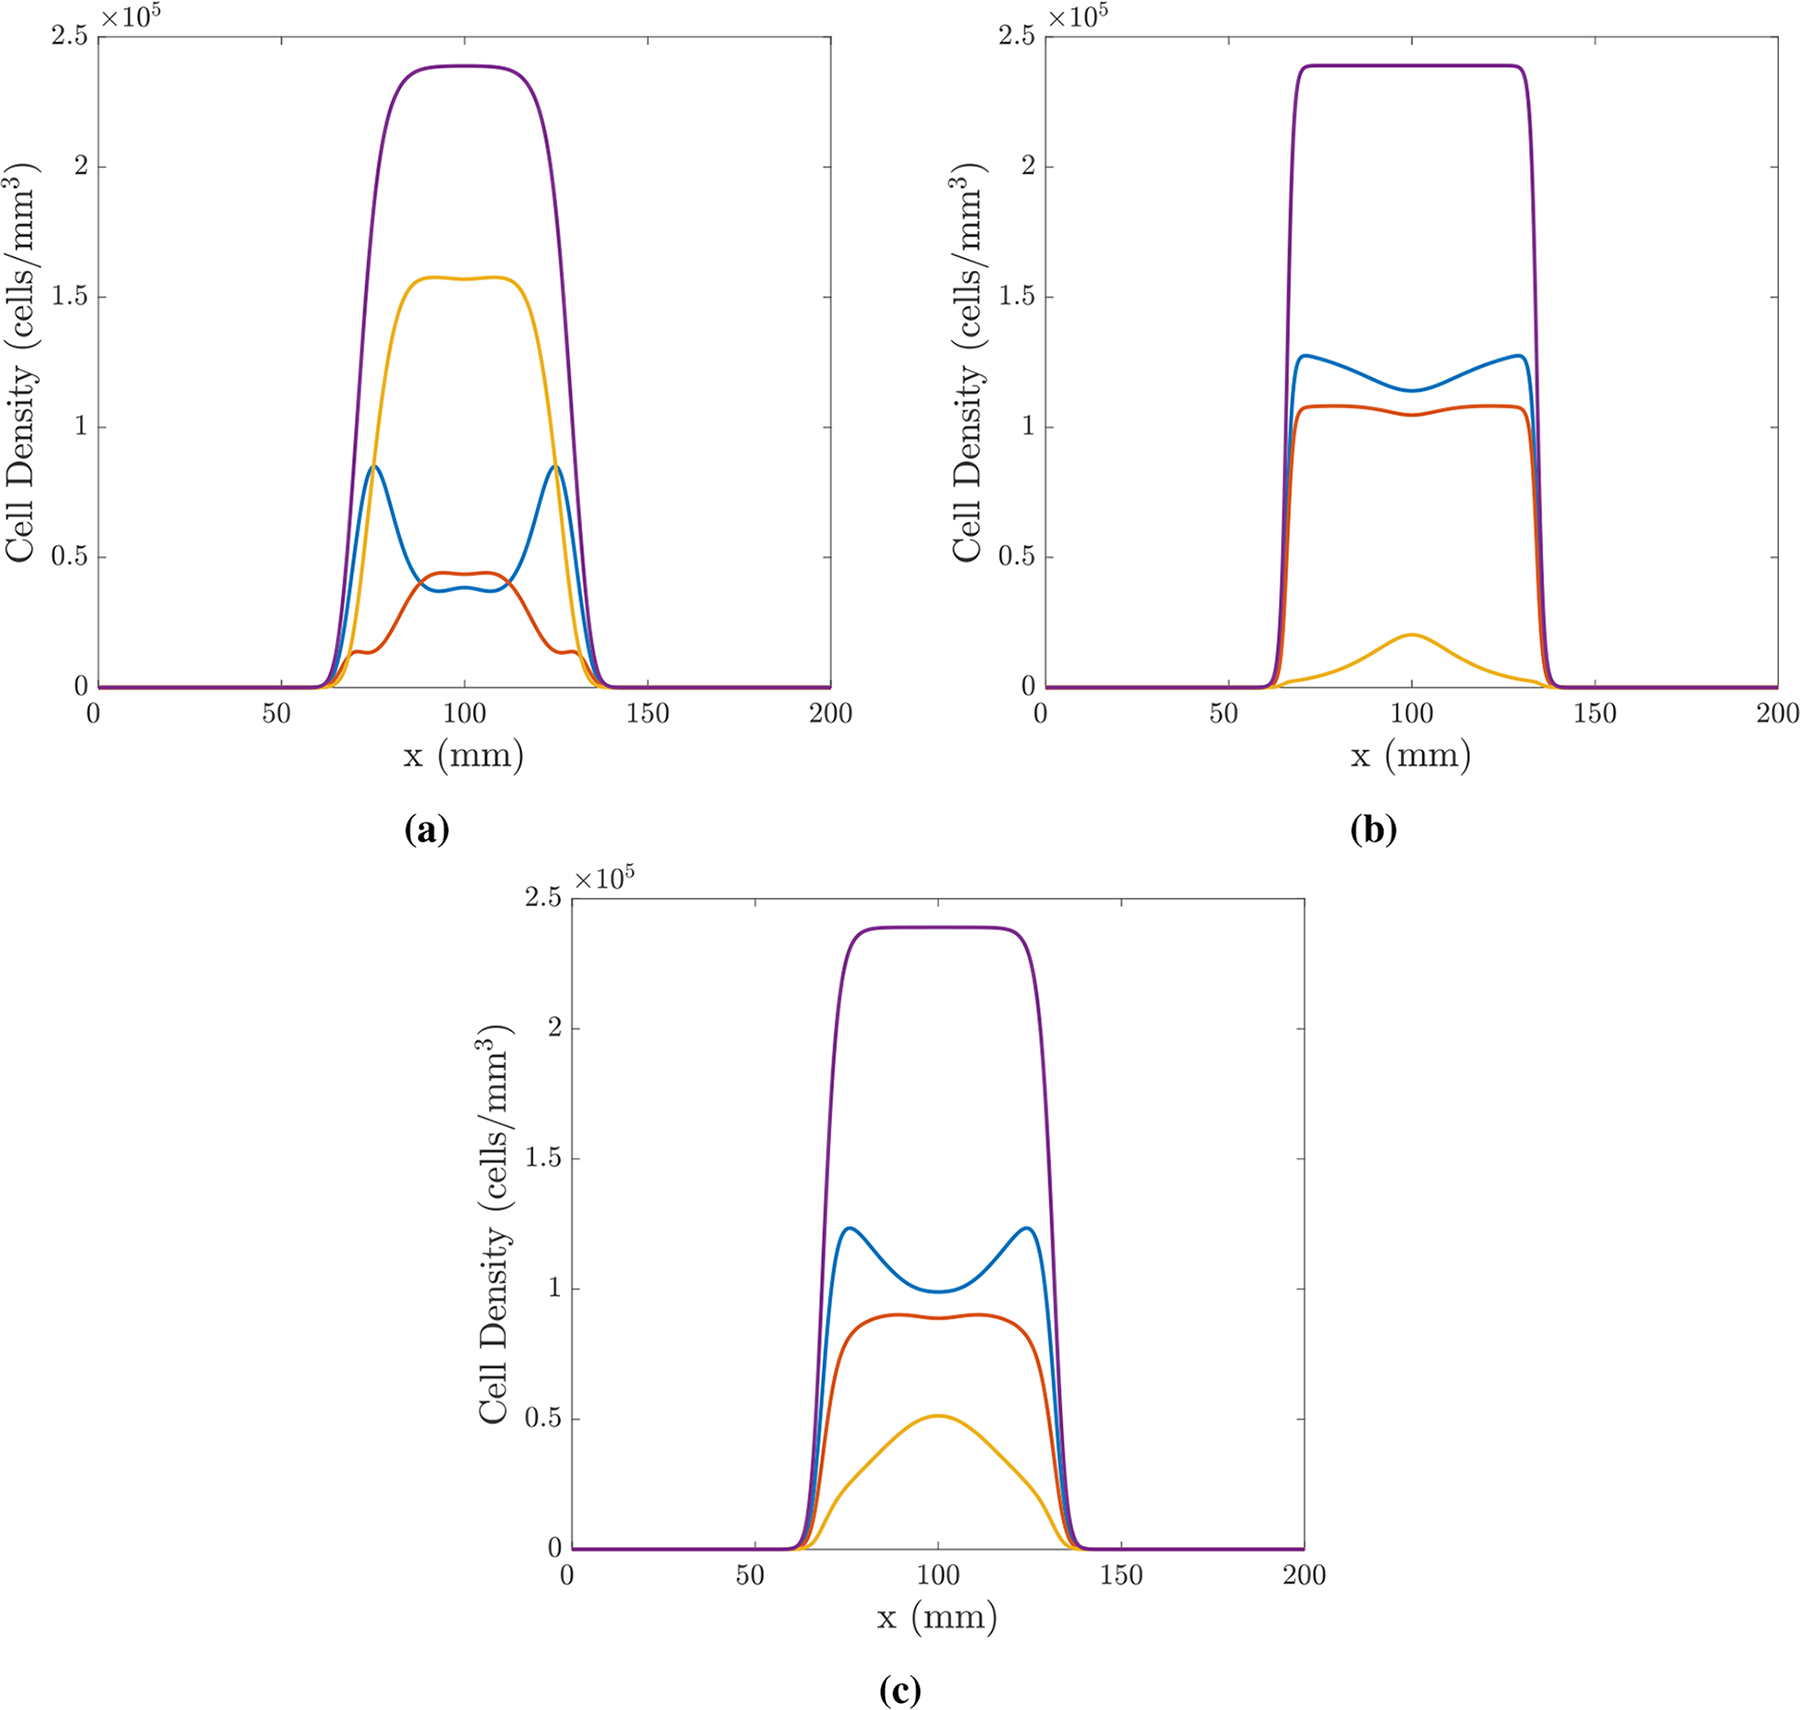
Simulations in 1D of the model given by Eqs (2.1)–(2.12) using the finite difference scheme described in Section 2.2 with parameters: ρE = 35.4, ρP = 33 and ρN = 30/year; DE = DP = DN = 30mm2/year; cells/mm3; ; , years. The interactions in each simulation are chosen to be (a) competition, αEP = αPE = −5, (b) cooperation, αEP = αPE = 5 and (c) neutralism, αEP = αPE = 0. Each simulation is plotted at t = 0.7 years; population E is shown in blue, P in red, N in yellow and the total population, T = E + P + N, in purple.