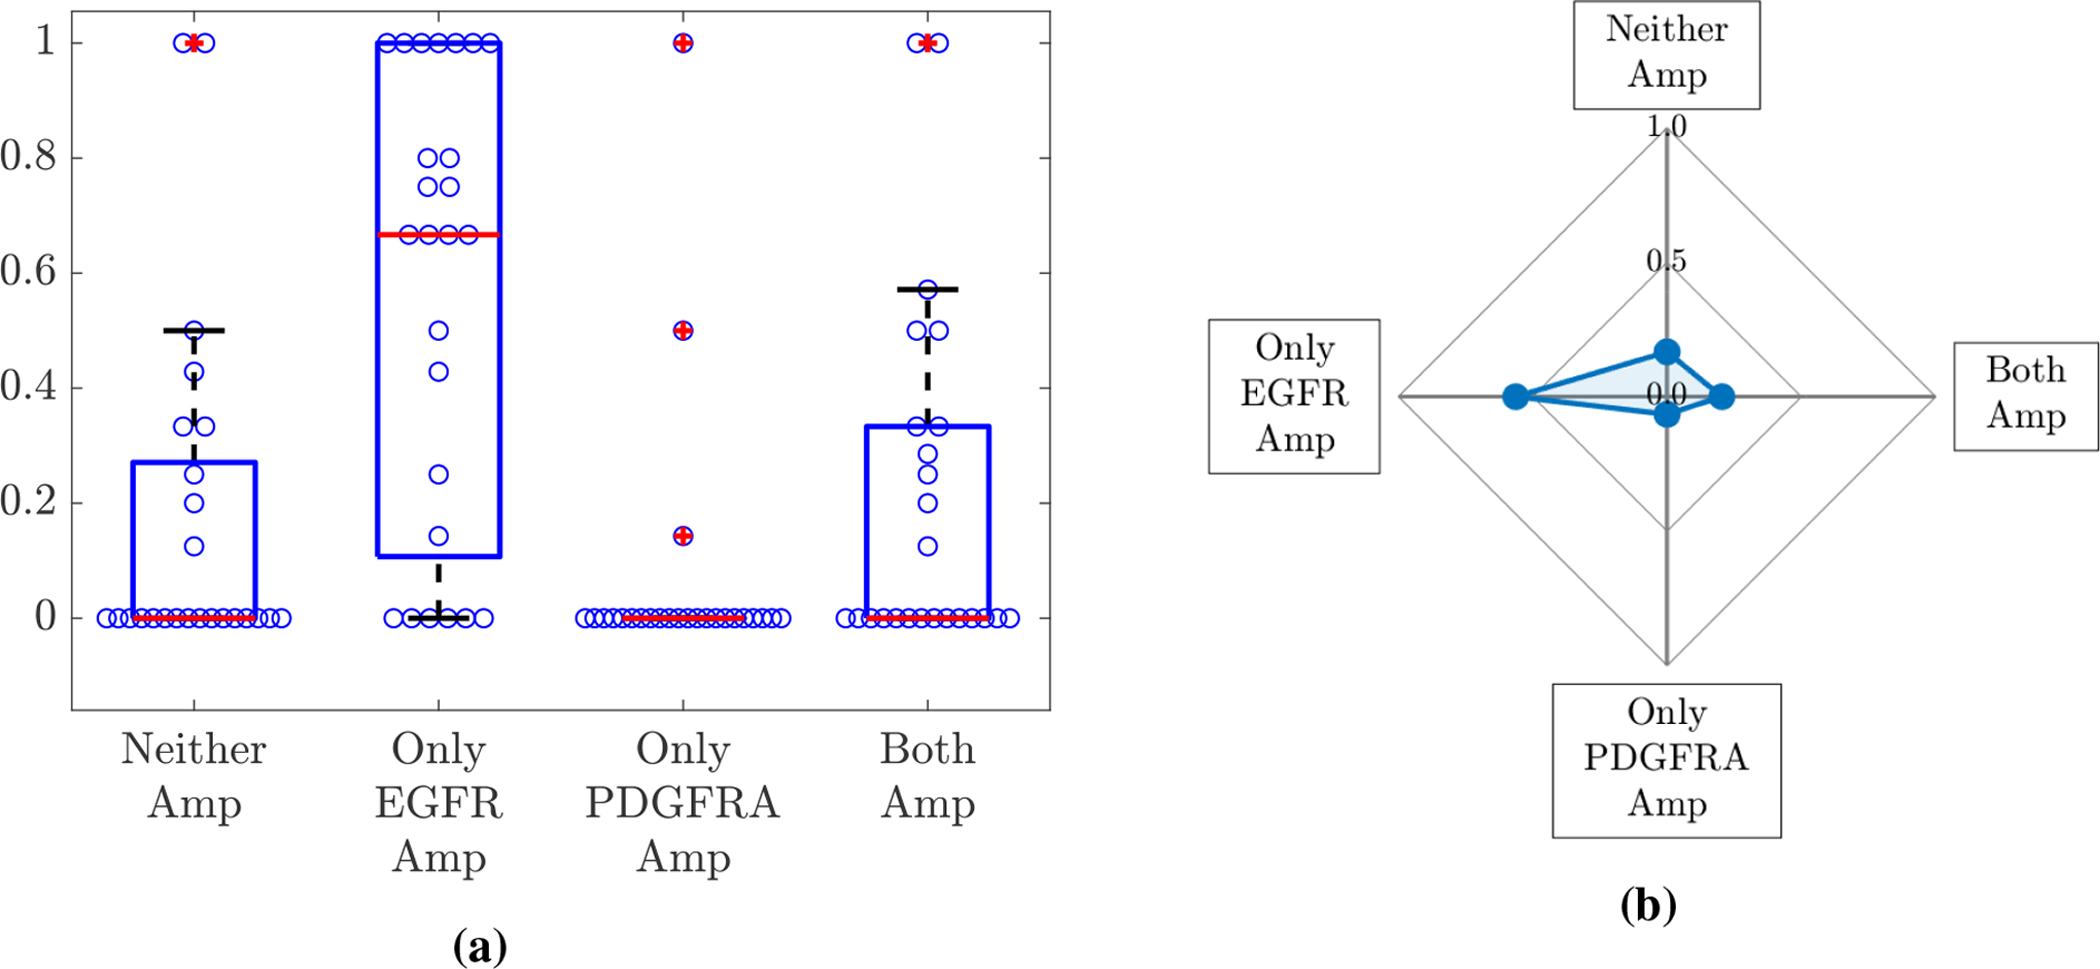
Figure 2.

(a) A box plot summarising the proportion of each individual’s biopsies that were determined to be amplified in neither gene (Neither), only the EGFR gene (Only EGFR Amp), only the PDGFRA gene (Only PDGFRA Amp) and both of the EGFR and PDGFRA genes (Both Amp) for the 25 patients. Each of the blue circles overlaid on the box plot represents the relevant proportion of an individual’s biopsies for each category. The means of these proportions across the 25 patients are shown in (b).
