
Figure 5.
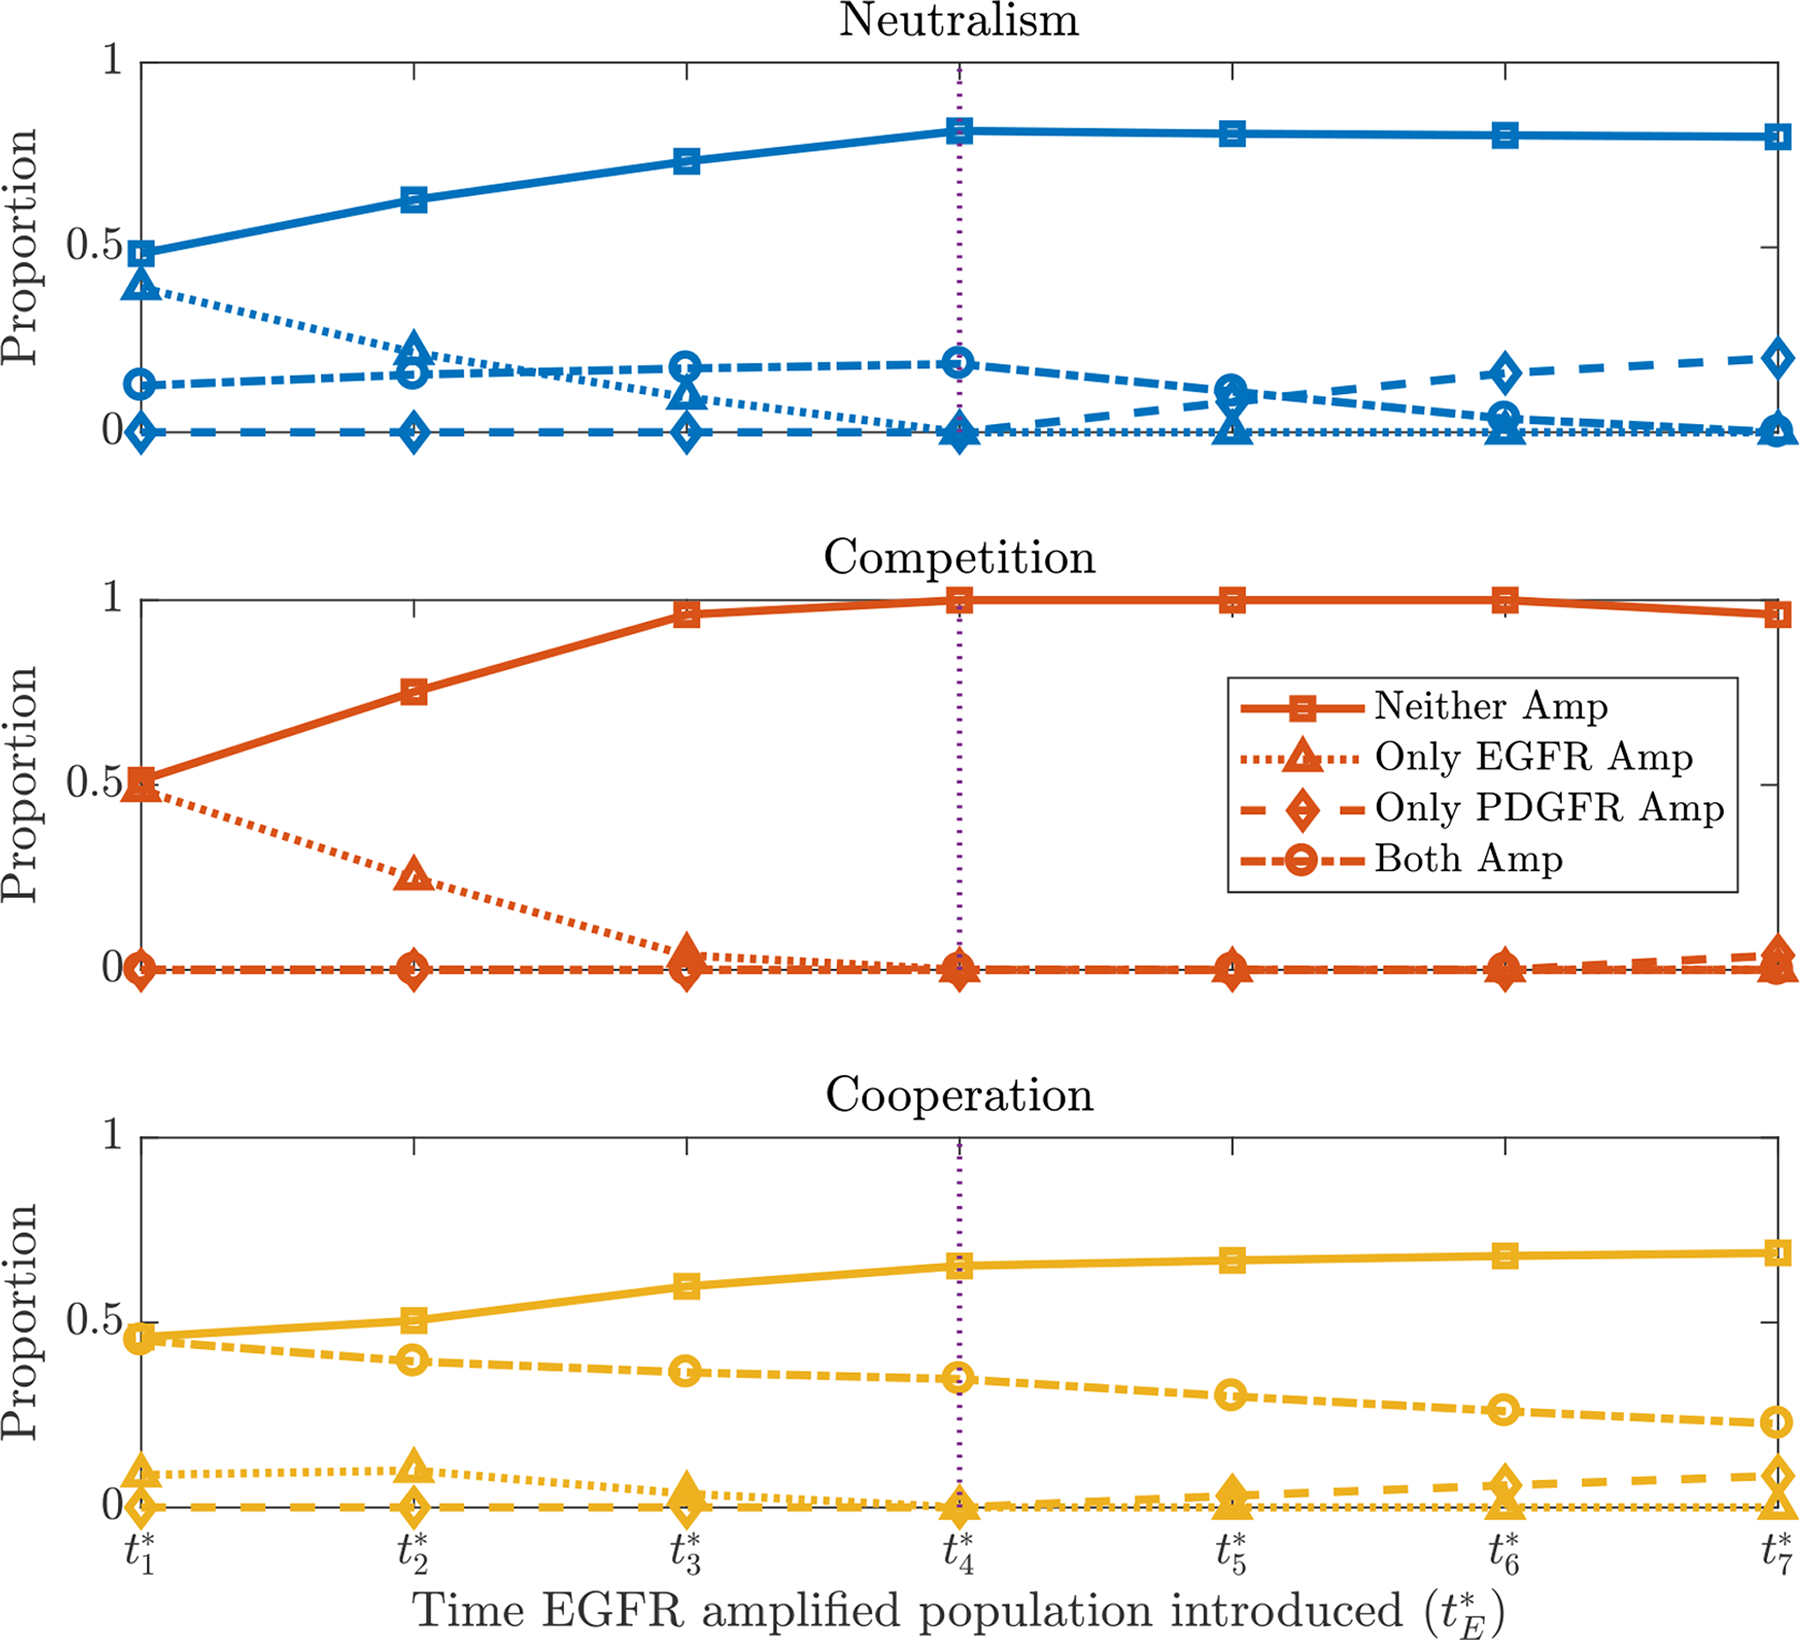
Plots showing the mean proportions of simulations with neither gene (Neither Amp), only the EGFR gene (Only EGFR Amp), only the PDGFRA gene (Only PDGFRA Amp) and both genes (Both Amp) amplified as is varied, under neutral, competitive and cooperative interactions. The PDGFRA amplified population is introduced at the fixed time (denoted by the vertical dotted line) and other parameters and assumptions are as described in Section 3.3.