
Figure 6.
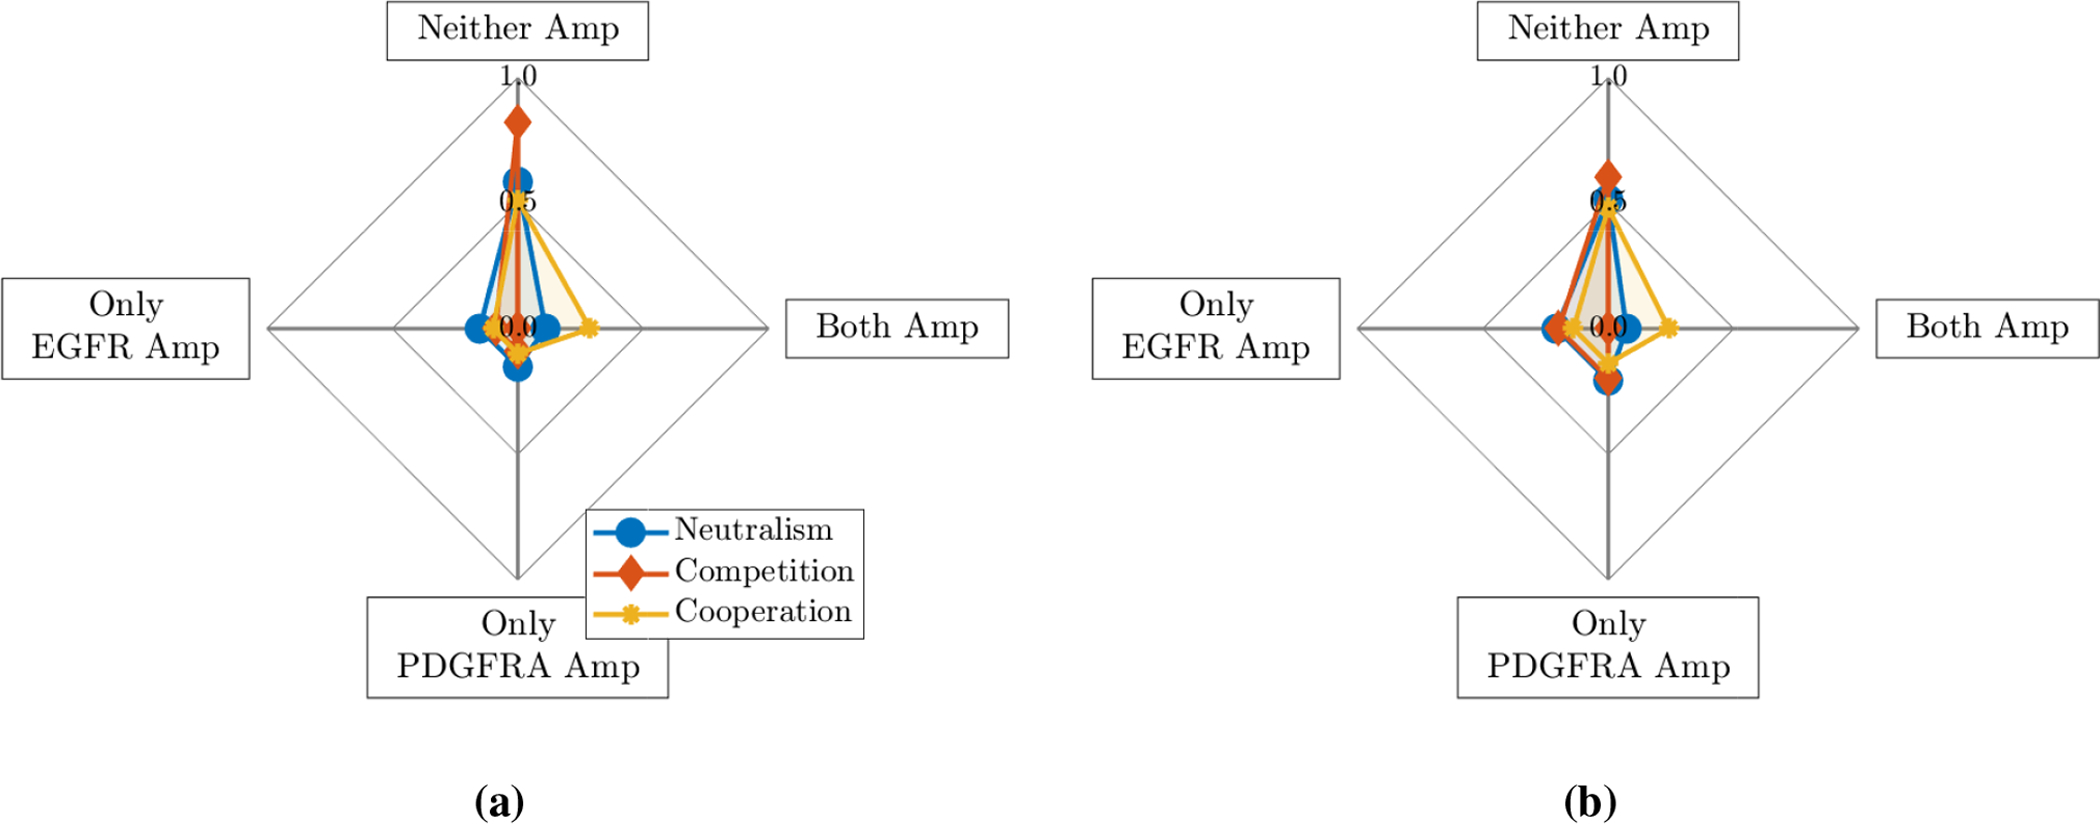
Sub-population distributions when mutations are introduced on opposite sides of the tumour: plots showing mean proportions of simulations with neither gene (Neither Amp), only the EGFR gene (Only EGFR Amp), only the PDGFRA gene (Only PDGFRA Amp) and both genes (Both Amp) amplified when EGFR and PDGFRA amplified sub-populations are introduced (a) 0.5mm to left and right of the center (i.e., and ) and (b) 1mm to left and right of the center (i.e., and ), respectively.