Figure 7.

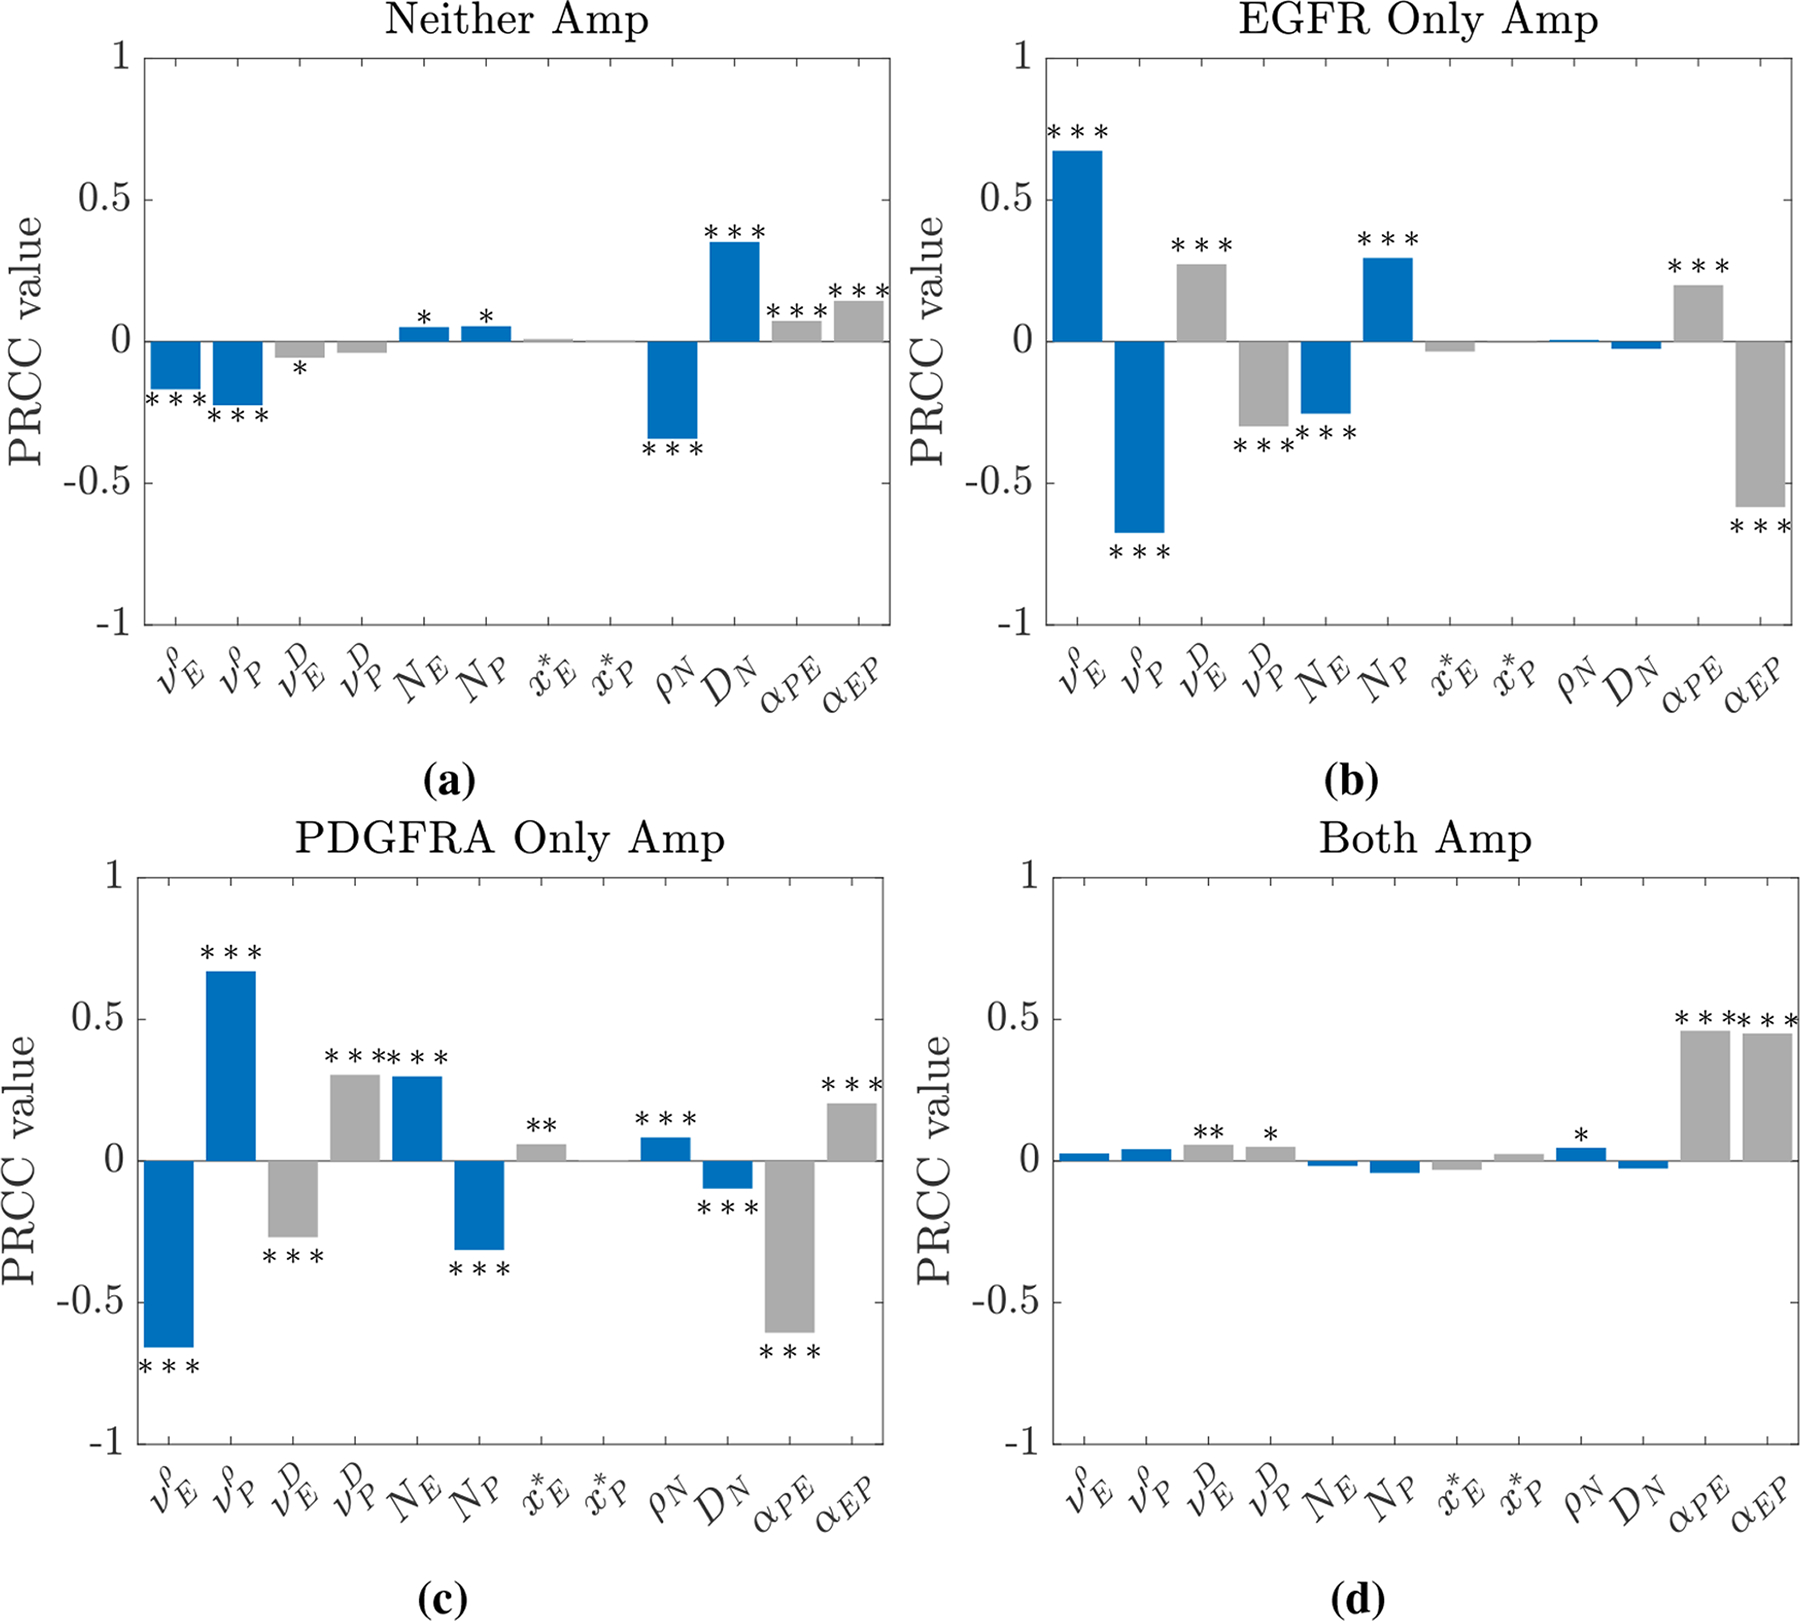
Bar plots showing PRCC values between each model parameter detailed in Table 2 and the four outputs of interest: the proportion of simulations with (a) neither, (b) only EGFR, (c) only PDGFRA and (d) both genes amplified. PRCC values significantly different from zero at the 0.05 (*), the 0.01 (**) and the 0.001 (***) levels are highlighted.
