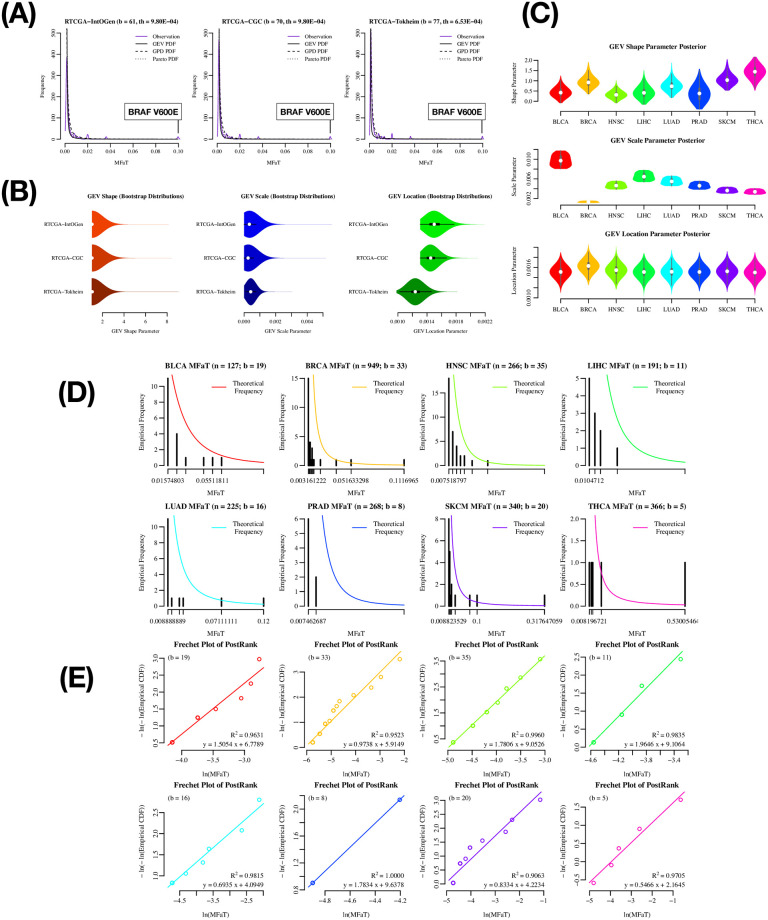
Fig 3. Bayesian MCMC approach for estimating tumor-type-specific GEV parameters.
In these analyses, only mutations filtered by gene symbols are analyzed (i.e., symbol-based filtering). In the total-tumor analysis, we used the IntOgen, CGC, and Tokheim driver-gene definitions, and in the case of tumor-type-specific analyses, we used only the IntOgen definition. (A) Density plot of MFaTs in the cases of the RTCGA total-tumor with symbol-based filtering. The colored solid line is the probability density of observations, the black solid line is the probability density function (PDF) of GEV, and the dotted lines are the PDFs of the GPD and Pareto distributions, respectively. For each plot, a gene symbol and an amino acid substitution of a mutation with the highest MFaT value is shown in a box. Here, “b” denotes the number of genomic sites of beneficial mutations considered, and “th” denotes the effective threshold against MFaTs when selecting mutations according to ranks (for details, see Materials and methods). (B) Bootstrap distributions of GEV parameters in the total-tumor analysis. We used the maximum likelihood method for the parameter estimation. The white point indicates the median of the distribution. The black square shows the first and the third quantiles. (C) Bootstrap distributions of GEV parameters in the tumor-type-specific analysis. We used the Bayesian MCMC method for the parameter estimation. The white point indicates the median of the distribution. The gray square shows the first and the third quantiles. (D) MFaT histograms with tumor-type-specific GEV densities. Black bars show frequencies in the histogram. The colored lines are estimated densities. (E) Type-specific Fréchet plots. The R2 values and the equations of the linear regression lines are shown. Here, “b” denotes the number of genomic sites of beneficial mutations considered.

