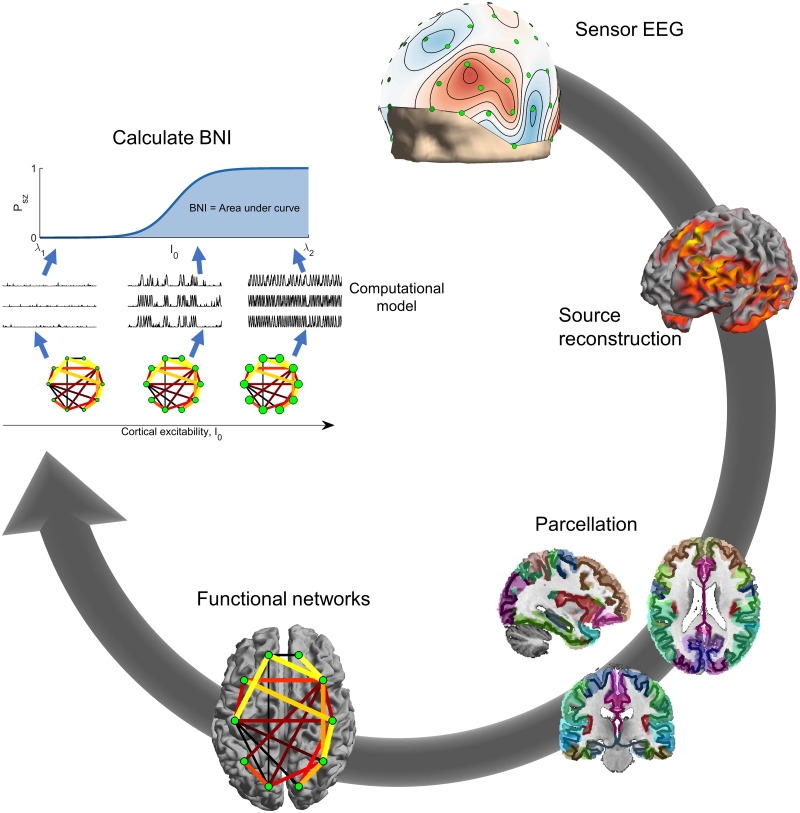
Fig 1. Calculation of BNI.
Clockwise from top: Sensor EEG was source reconstructed using the eLORETA algorithm. The source solution was parcellated into 40 ROIs given by the Brainnetome atlas. Functional networks were calculated from the parcellated time courses of the 40 regions using theta-band phase locking factor. BNI was calculated by placing the network into a model of seizure transitions, and increasing the excitability of cortical tissue in the model. For each value of the excitability parameter I0 (visualised by node size in the figure), the fraction of time spent in the seizure state by the simulated dynamics was calculated. BNI was the area under the curve of fraction of seizure time against I0.

