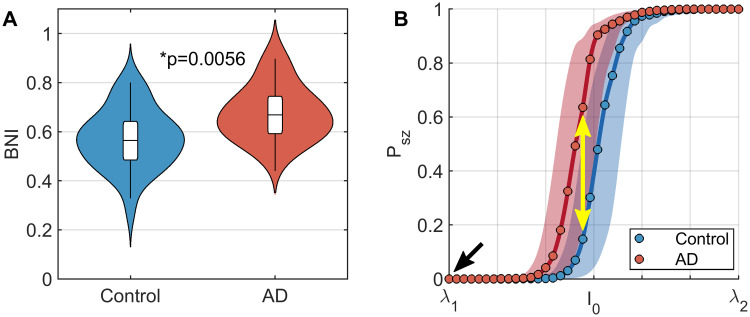
Fig 2. Functional brain networks in AD are more susceptible to seizure generation in response to increase cortical excitability than controls.
(A) Violin plots of BNI in people with AD and controls. BNI is significantly higher in AD. (B) Plots of seizure likelihood, Psz, against excitability, I0. Lines show median values over all participants within a group, while shaded regions show interquartile ranges. Circles show the grid of values on which I0 was simulated. The values of BNI shown in subplot A are the area under these curves for each participant. The black arrow shows a hypothetical ‘current’ baseline, in which no participants have seizures. The yellow arrow shows that if cortical excitability increases, AD participants are more likely to experience seizures than controls. Parameters: K = 10, λ1 = −1.7, and λ2 = −0.5.

