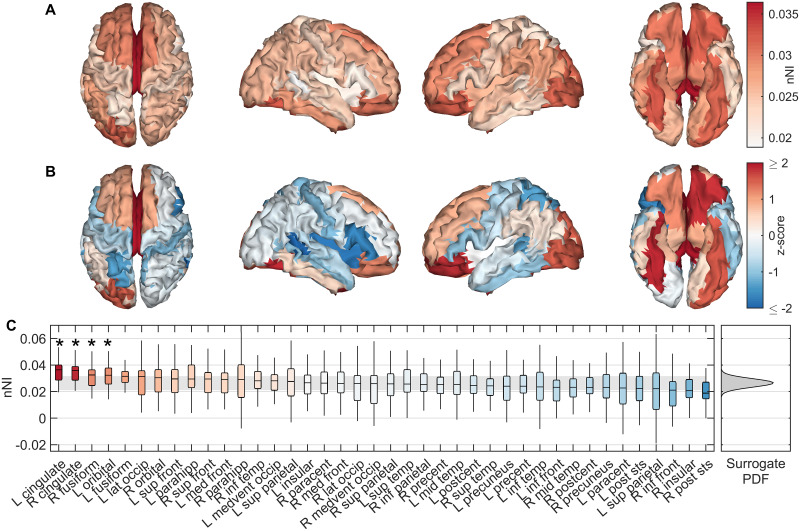
Fig 3. Spatial distributions of seizure generating regions in AD simulations.
(A) Median nNI over participants for each ROI. (B) z-scores of median nNI against the surrogate distribution. Red scores suggest the nNI score was larger than expected from a homogeneous distribution, suggesting these regions are most strongly responsible for generating seizures. (C) nNI values for regions sorted by median over participants by descending nNI. Background colour shows z-score. The shaded grey region shows empirical 95% confidence intervals on the surrogate data, while the full (Gaussian) probability density function of the surrogate data is shown on the right. ROIs marked by an asterisk were significant to (FDR corrected) p < 0.05. Full names of ROIs along with the abbreviations given here are given in S1 Table. Parameters are those given in Fig 2.

