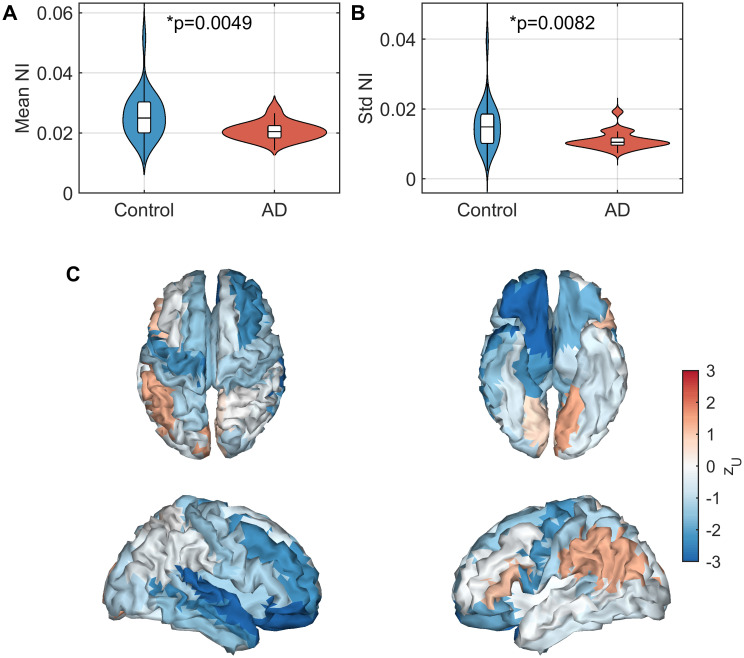
Fig 4. Analysis of NI scores in AD relative to controls.
(A) Mean NI across nodes. (B) Standard deviation of NI across nodes. (C) Effect sizes of differences in NI between AD and controls for each ROI, quantified by the z-score of the U-statistic. Parameters are those given in Fig 2.

