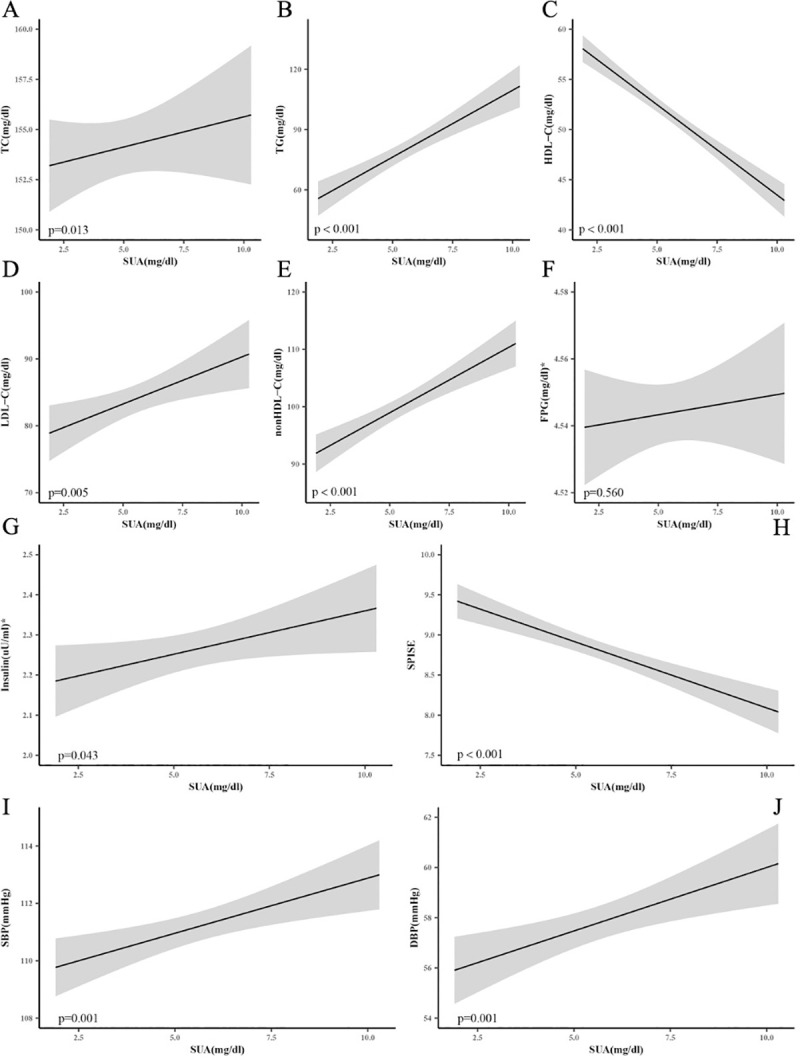
Fig 2. Plots show the non-linear regression models for SUA and cardiovascular risk in US adolescents 2001–2018.

Analyses were adjusted for age, gender, race, PIR, TV time, computer time, BMIZ, WHtR and eGFR. SUA, serum uric acid; TC, total cholesterol; TG, triglycerides; HDL-C, high density lipoprotein cholesterol; LDL-C, low density lipoprotein cholesterol; nonHDL-C, Non-HDL cholesterol; FPG, fasting plasma glucose; SPISE, Single Point Insulin Sensitivity Estimator; SBP, mean systolic blood pressures; DBP, mean diastolic blood pressures. *Data were logarithmically transformed.
