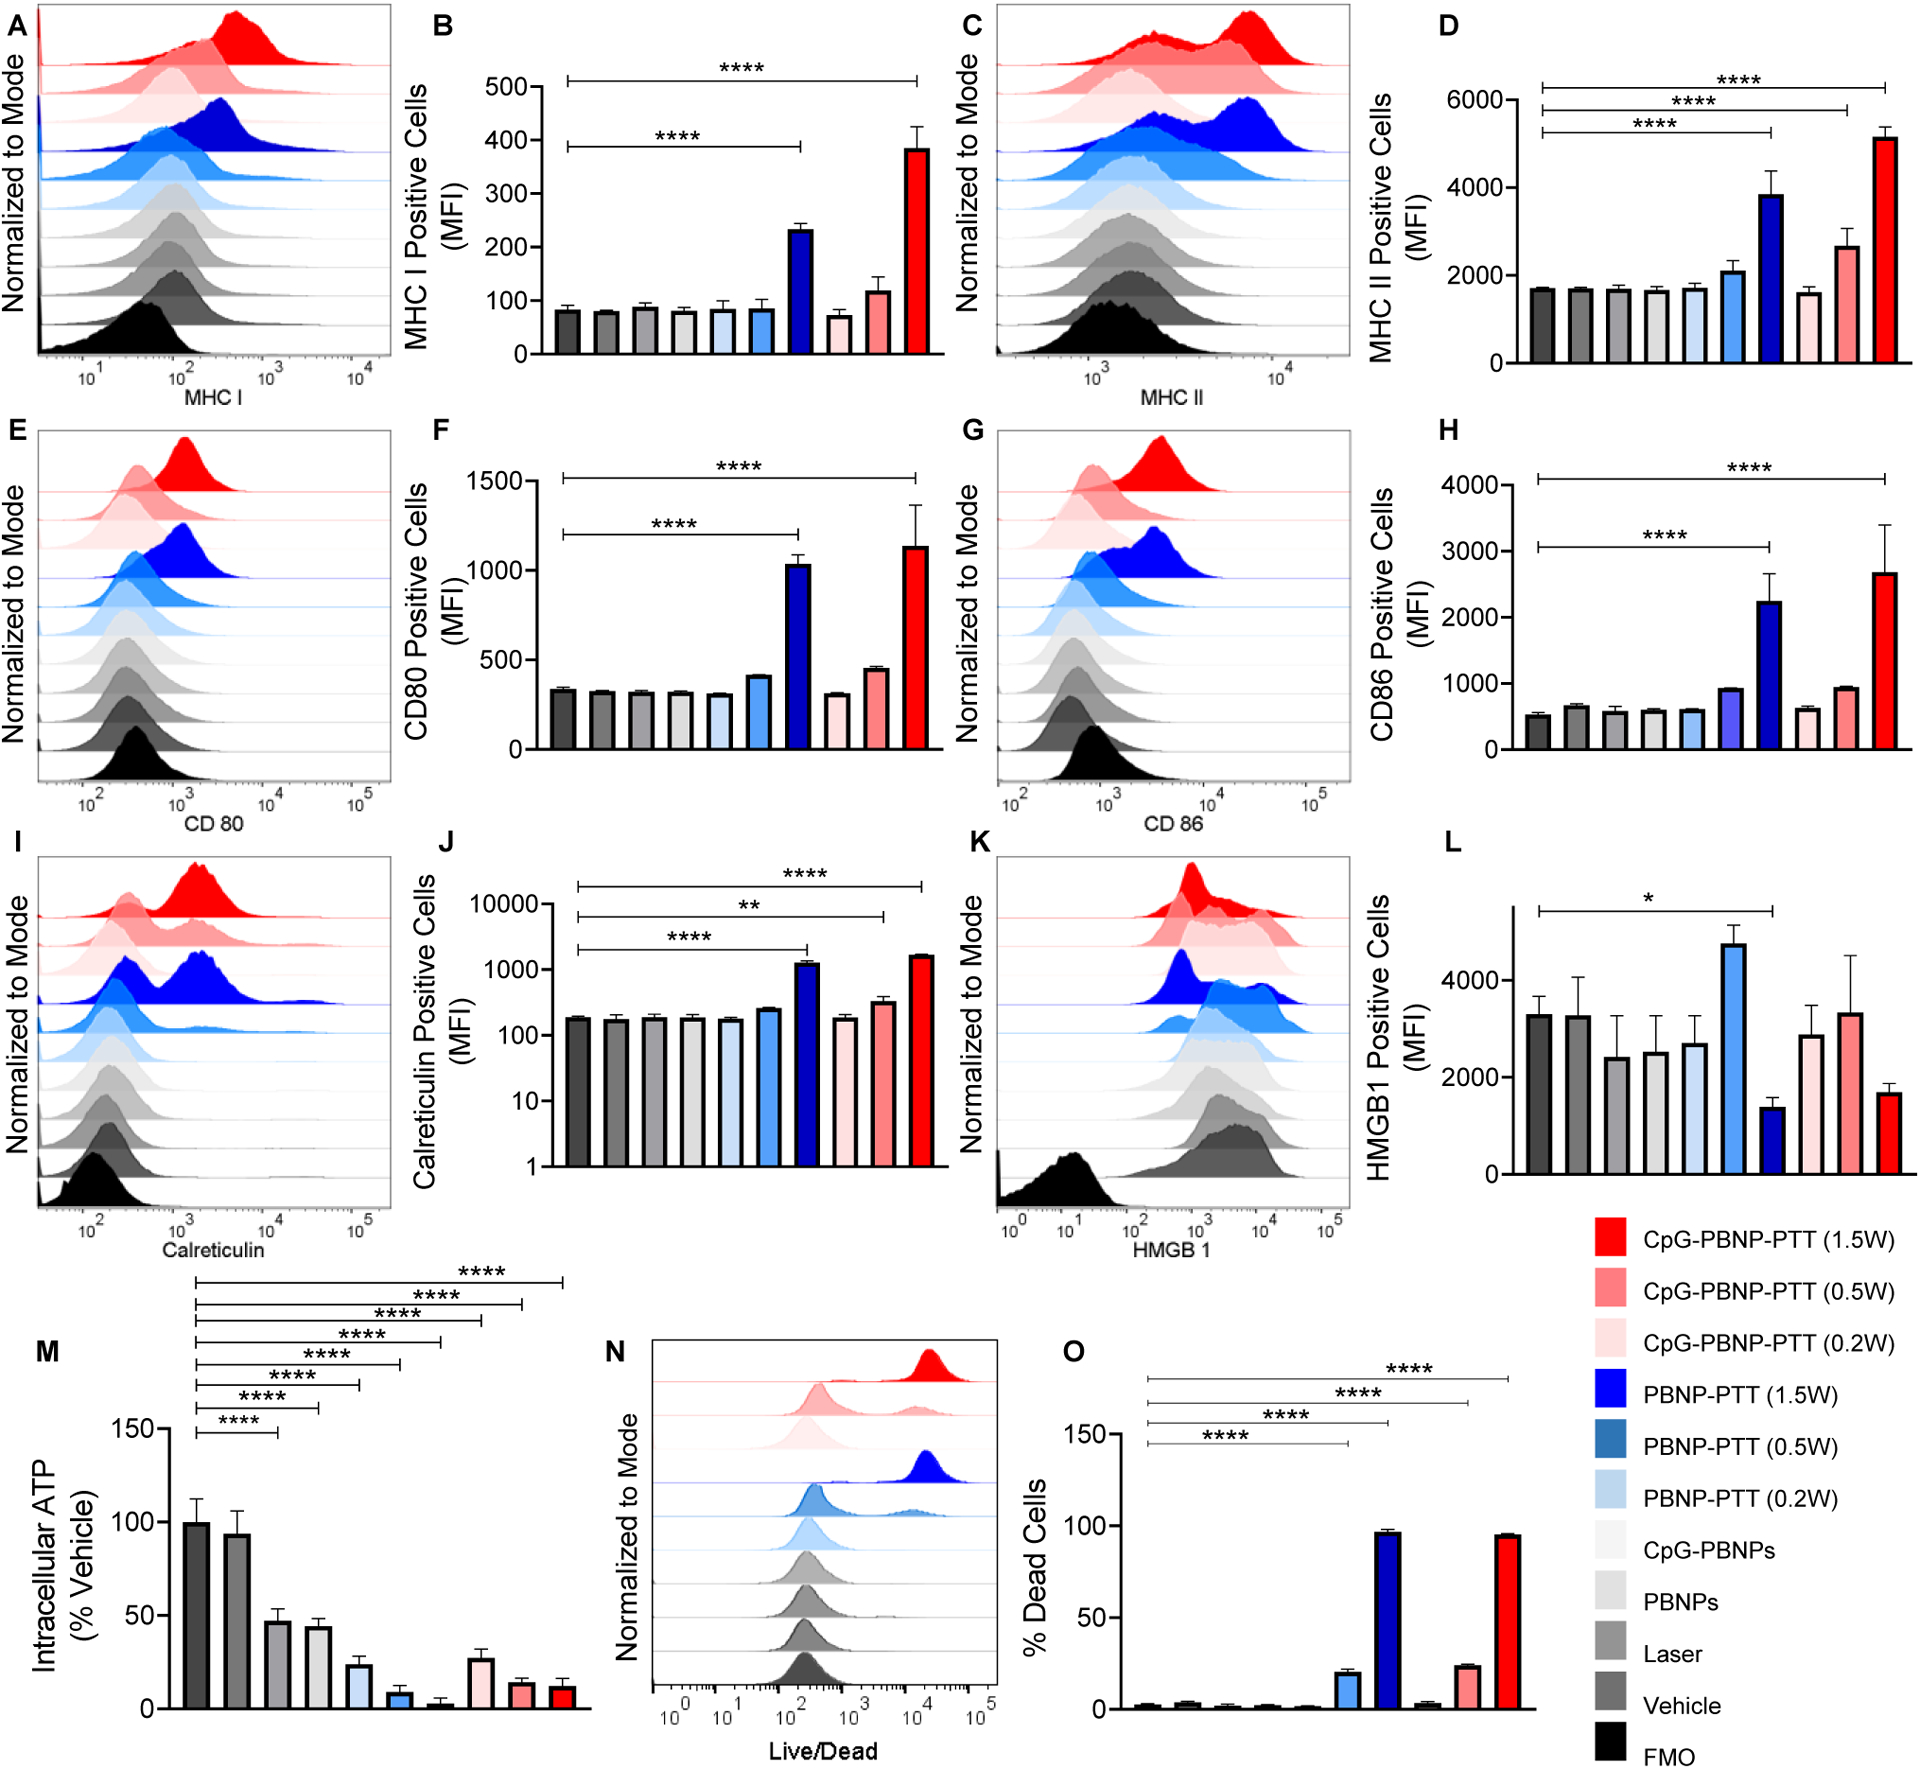
Figure 2. CpG-PBNP-PTT-induced immune modulation and ICD in 9464D NB cells in vitro.

9464D NB cells cultured in vitro were treated with vehicle (PBS), laser (1.5 W), PBNPs (0.15 mg mL−1), CpG-PBNPs (0.15 mg mL−1), PBNP-PTT (0.15 mg mL−1 at 0.2, 0.5, and 1.5 W), or CpG-PBNP-PTT (0.15 mg mL−1 at 0.2, 0.5, and 1.5 W), and analyzed 24 h post PTT. (A–B) Surface MHC I expression levels in the various treatment groups analyzed by flow cytometry represented as (A) histograms, and (B) MFI (mean fluorescence intensity). (C–D) Surface MHC II expression levels in the various treatment groups analyzed by flow cytometry represented as (C) histograms, and (D) MFI. (E–F) Surface CD80 expression levels in the various treatment groups analyzed by flow cytometry represented as (E) histograms, and (F) MFI. (G–H) Surface CD86 expression levels in the various treatment groups analyzed by flow cytometry represented as (G) histograms, and (H) MFI. (I–J) Surface calreticulin expression levels in the various treatment groups analyzed by flow cytometry represented as (I) histograms, and (J) MFI. (K–L) Intracellular HMGB1 expression levels in the various treatment groups analyzed by flow cytometry represented as (K) histograms, and (L) MFI. (M) Intracellular ATP levels in the various treatment groups (as % of the vehicle-treated group) analyzed by CellTiter-Glo luminescent cell viability assay. (N–O) Quantification of cell death in the various treatment groups analyzed by flow cytometry represented as (N) histograms, and (O) as % of the vehicle-treated group. Results are expressed as mean ± std. deviation (n=3); *p < 0.05, **p < 0.01, ***p < 0.001, ****p < 0.0001 (ANOVA). FMO (fluorescence minus one control).
