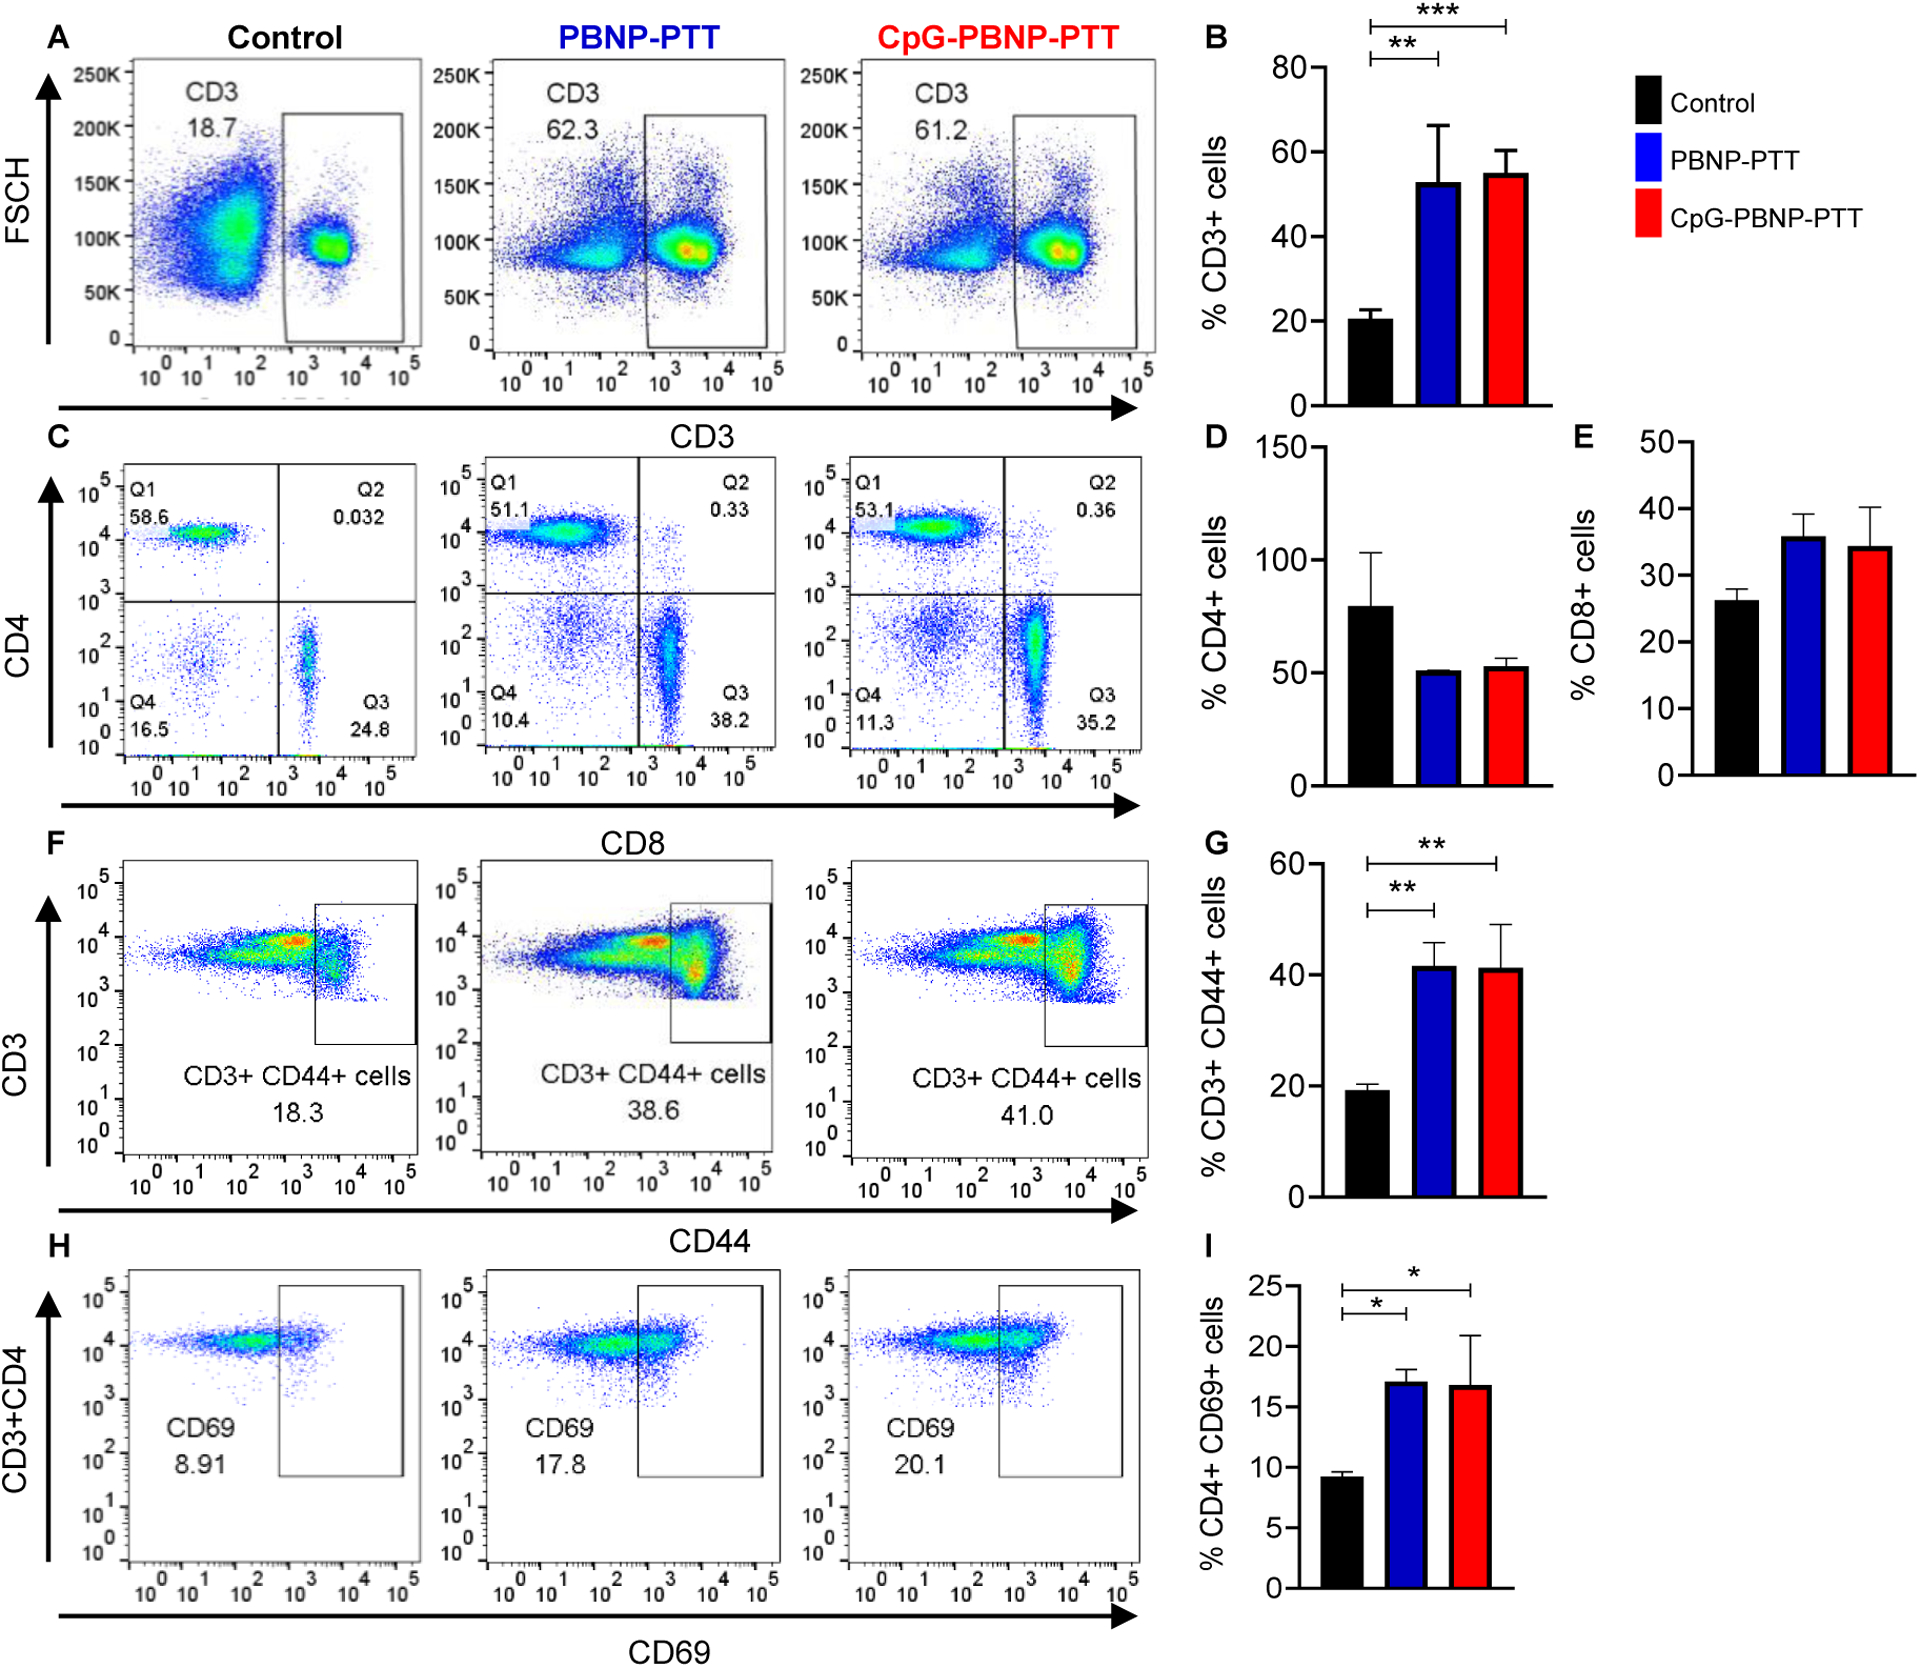
Figure 4. Immunostimulatory effects of CpG-PBNP-PTT on long-term surviving rechallenged mice.

(A) Representative histograms of CD3+ cells in the spleens of PBNP-PTT and CpG-PBNP-PTT rechallenge mice compared to age-matched, treatment-naive control mice. (B) %CD3+ cells in the PBNP-PTT and CpG-PBNP-PTT rechallenged mice as compared to mice in the control group. (C) Representative scatter plots of CD4+ and CD8+ cells (gated on CD3+ cells) in the splenocytes of rechallenged mice compared to control mice. (D) %CD4+ cells in the PBNP-PTT and CpG-PBNP-PTT rechallenged mice as compared to control mice. (E) %CD8+ cells in the PBNP-PTT and CpG-PBNP-PTT rechallenged mice as compared to control mice. (F) Representative scatter plots of CD3+ CD44+ memory cells in the splenocytes of PBNP-PTT and CpG-PBNP-PTT rechallenged mice compared to control mice. (G) %CD3+ CD44+ memory cells in the PBNP-PTT and CpG-PBNP-PTT rechallenged mice as compared to control mice. (H) Representative scatter plots of CD4+ CD69+ memory cells in the splenocytes of rechallenged mice compared to control mice. (I) %CD4+ CD69+ cells in the PBNP-PTT and CpG-PBNP-PTT rechallenged mice as compared to control mice. Results are expressed as mean ± std. deviation; Treatment-naive control (n=4), PBNP-PTT (n=2), CpG-PBNP-PTT (n=4); *p < 0.05, **p < 0.01, ***p < 0.001 (ANOVA).
