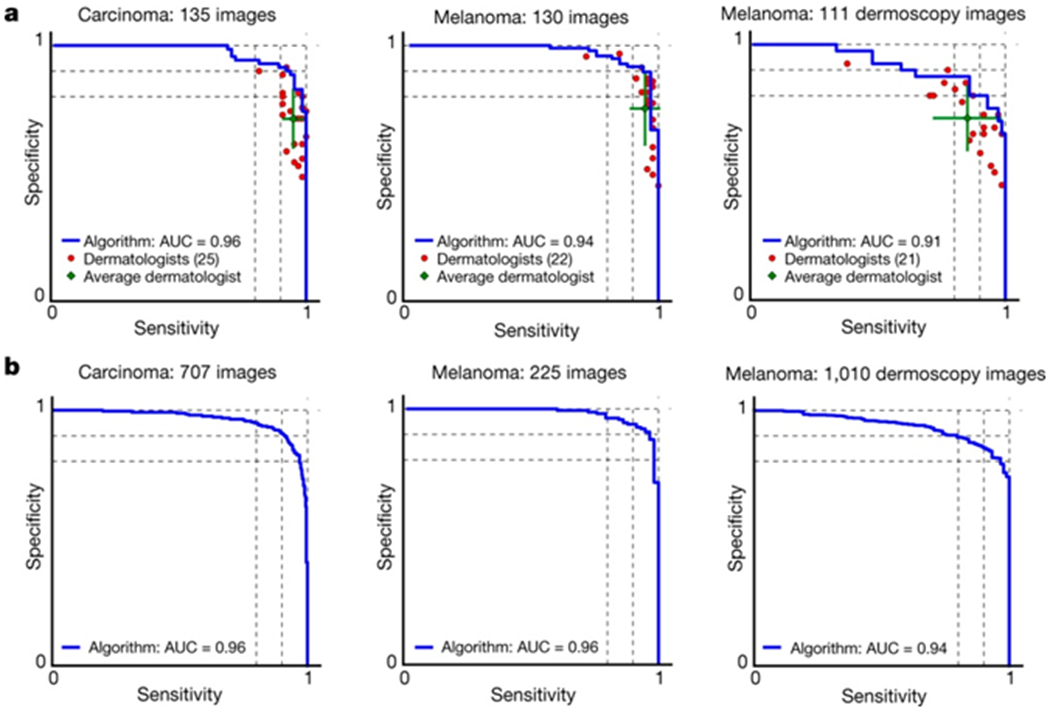
Figure 3 |. Skin cancer classification performance of the CNN and dermatologists.

a, The deep learning CNN outperforms the average of the dermatologists at skin cancer classification using photographic and dermoscopic images. Our CNN is tested against at least 21 dermatologists at keratinocyte carcinoma and melanoma recognition. For each test, previously unseen, biopsy-proven images of lesions are displayed, and dermatologists are asked if they would: biopsy/treat the lesion or reassure the patient. Sensitivity, the true positive rate, and specificity, the true negative rate, measure performance. A dermatologist outputs a single prediction per image and is thus represented by a single red point. The green points are the average of the dermatologists for each task, with error bars denoting one standard deviation (calculated from n = 25, 22 and 21 tested dermatologists for keratinocyte carcinoma, melanoma and melanoma under dermoscopy, respectively). The CNN outputs a malignancy probability P per image. We fix a threshold probability t such that the prediction for any image is , and the blue curve is drawn by sweeping t in the interval 0–1. The AUC is the CNN’s measure of performance, with a maximum value of 1. The CNN achieves superior performance to a dermatologist if the sensitivity–specificity point of the dermatologist lies below the blue curve, which most do. Epidermal test: 65 keratinocyte carcinomas and 70 benign seborrheic keratoses. Melanocytic test: 33 malignant melanomas and 97 benign nevi. A second melanocytic test using dermoscopic images is displayed for comparison: 71 malignant and 40 benign. The slight performance decrease reflects differences in the difficulty of the images tested rather than the diagnostic accuracies of visual versus dermoscopic examination. b, The deep learning CNN exhibits reliable cancer classification when tested on a larger dataset. We tested the CNN on more images to demonstrate robust and reliable cancer classification. The CNN’s curves are smoother owing to the larger test set.
