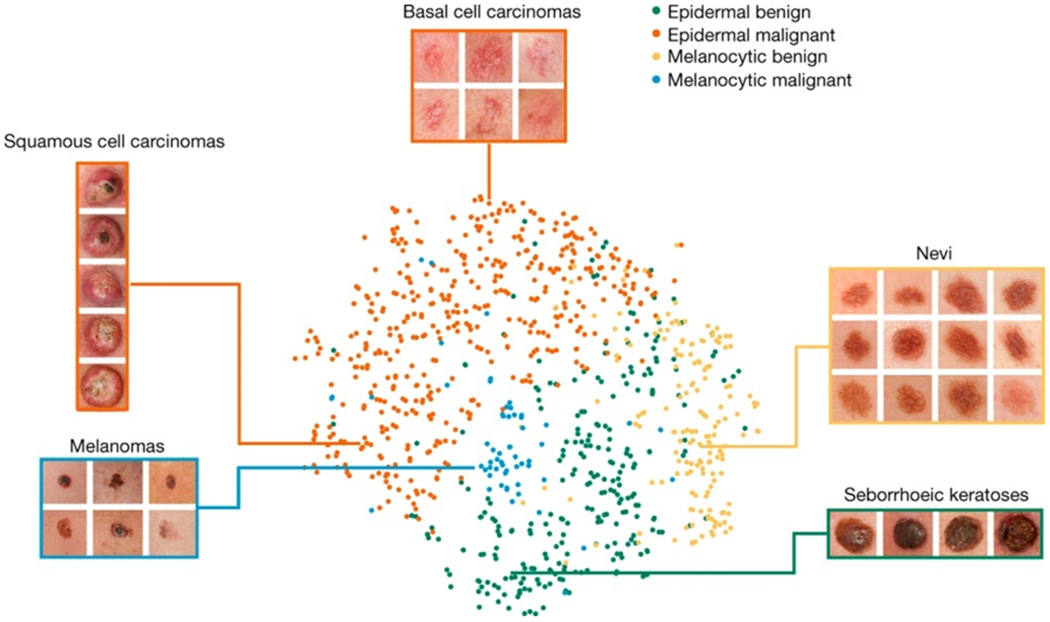
Figure 4 |. t-SNE visualization of the last hidden layer representations in the CNN for four disease classes.

Here we show the CNN’s internal representation of four important disease classes by applying t-SNE, a method for visualizing high-dimensional data, to the last hidden layer representation in the CNN of the biopsy-proven photographic test sets (932 images). Coloured point clouds represent the different disease categories, showing how the algorithm clusters the diseases. Insets show images corresponding to various points. Images reprinted with permission from the Edinburgh Dermofit Library (https://licensing.eri.ed.ac.uk/i/software/dermofit-image-library.html).
