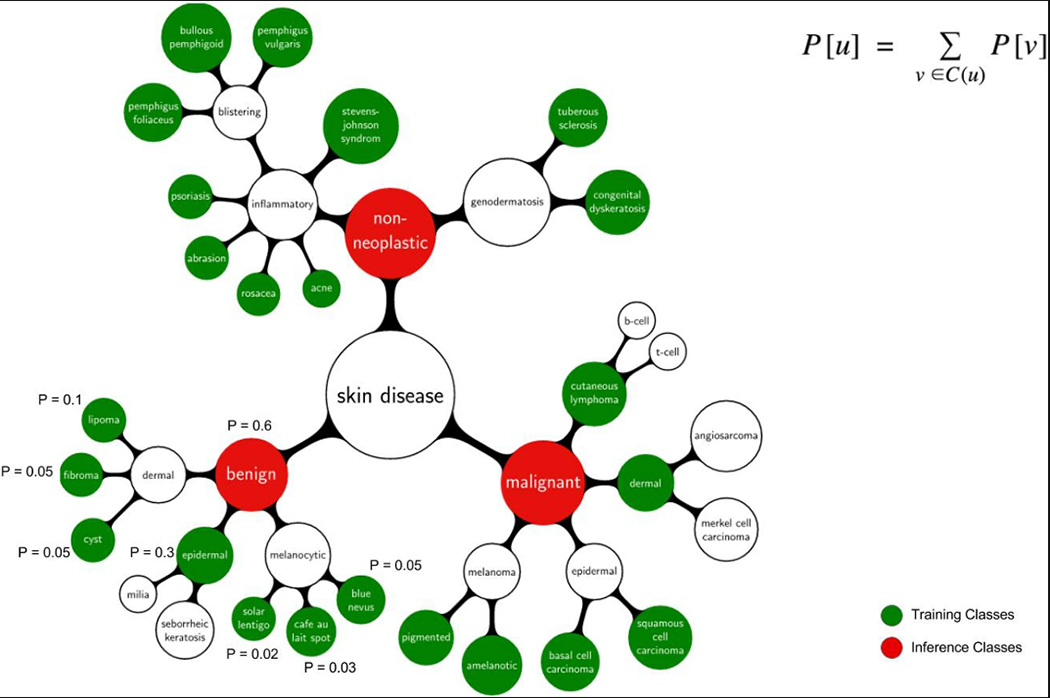
Extended Data Figure 1 |. Procedure for calculating inference class probabilities from training class probabilities.

Illustrative example of the inference procedure using a subset of the taxonomy and mock training/inference classes. Inference classes (for example, malignant and benign lesions) correspond to the red nodes in the tree. Training classes (for example, amelanotic melanoma, blue nevus), which were determined using the partitioning algorithm with maxClassSize = 1,000, correspond to the green nodes in the tree. White nodes represent either nodes that are contained in an ancestor node’s training class or nodes that are too large to be individual training classes. The equation represents the relationship between the probability of a parent node, u, and its children, C(u); the sum of the child probabilities equals the probability of the parent. The CNN outputs a distribution over the training nodes. To recover the probability of any inference node it therefore suffices to sum the probabilities of the training nodes that are its descendants. A numerical example is shown for the benign inference class: Pbenign = 0.6 = 0.1 + 0.05 + 0.05 + 0.3 + 0.02 + 0.03 + 0.05.
