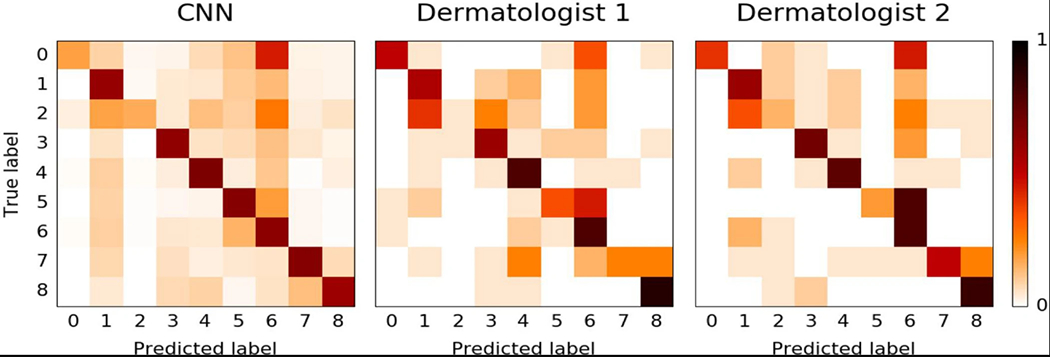
Extended Data Figure 2 |. Confusion matrix comparison between CNN and dermatologists.

Confusion matrices for the CNN and both dermatologists for the nine-way classification task of the second validation strategy reveal similarities in misclassification between human experts and the CNN. Element (i, j) of each confusion matrix represents the empirical probability of predicting class j given that the ground truth was class i, with i and j referencing classes from Extended Data Table 2d. Note that both the CNN and the dermatologists noticeably confuse benign and malignant melanocytic lesions—classes 7 and 8—with each other, with dermatologists erring on the side of predicting malignant. The distribution across column 6—inflammatory conditions—is pronounced in all three plots, demonstrating that many lesions are easily confused with this class. The distribution across row 2 in all three plots shows the difficulty of classifying malignant dermal tumours, which appear as little more than cutaneous nodules under the skin. The dermatologist matrices are each computed using the 180 images from the nine-way validation set. The CNN matrix is computed using a random sample of 684 images (equally distributed across the nine classes) from the validation set.
