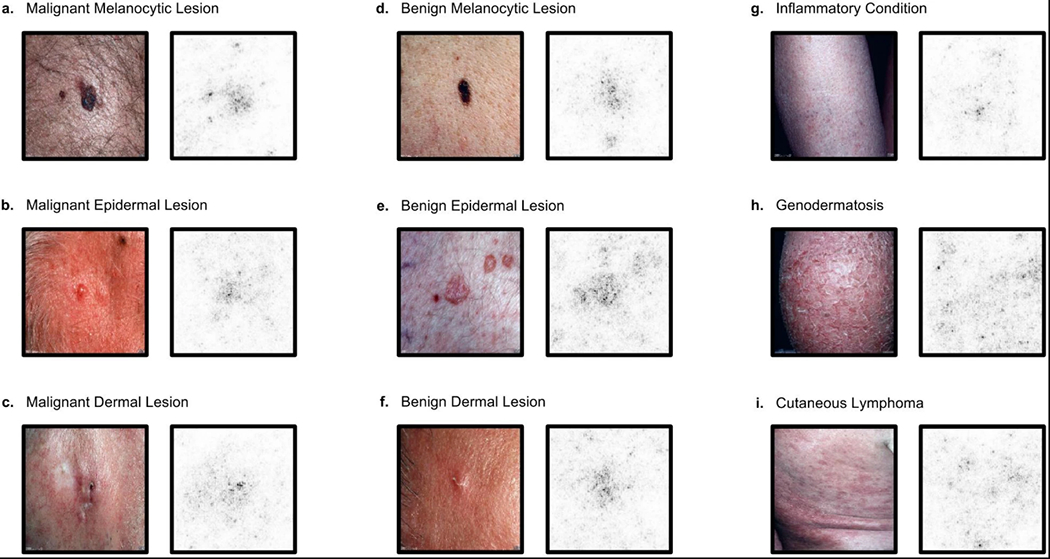
Extended Data Figure 3 |. Saliency maps for nine example images from the second validation strategy.

a–i, Saliency maps for example images from each of the nine clinical disease classes of the second validation strategy reveal the pixels that most influence a CNN’s prediction. Saliency maps show the pixel gradients with respect to the CNN’s loss function. Darker pixels represent those with more influence. We see clear correlation between the lesions themselves and the saliency maps. Conditions with a single lesion (a–f) tend to exhibit tight saliency maps centred around the lesion. Conditions with spreading lesions (g–i) exhibit saliency maps that similarly occupy multiple points of interest in the images. a, Malignant melanocytic lesion (source image: https://www.dermquest.com./imagelibrary/large/020114HB.JPG). b, Malignant epidermal lesion (source image: https://www.dermquest.com/imagelibrary/large/001883HB.JPG). c, Malignant dermal lesion (source image: https://www.dermquest.com/imagelibrary/large/019328HB.JPG). d, Benign melanocytic lesion (source image: https://www.dermquest.com/imagelibrary/large/010137HB.JPG). e, Benign epidermal lesion (source image: https://www.dermquest.com/imagelibrary/large/046347HB.JPG). f, Benign dermal lesion (source image: https://www.dermquest.com/imagelibrary/large/021553HB.JPG). g, Inflammatory condition (source image: https://www.dermquest.com/imagelibrary/large/030028HB.JPG). h, Genodermatosis (source image: https://www.dermquest.com/imagelibrary/large/030705VB.JPG). i, Cutaneous lymphoma (source image: https://www.dermquest.com/imagelibrary/large/030540VB.JPG).
