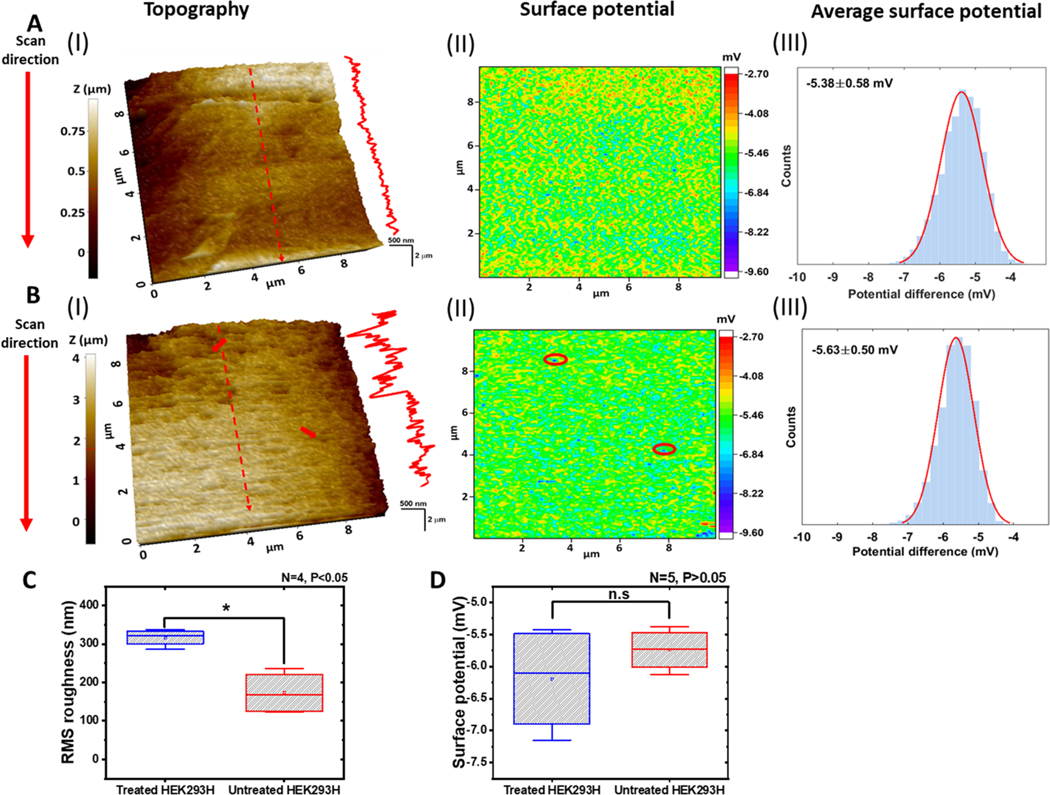
Figure 4.
SICM images of live HEK293H cells. (A, B) Topography (I) and potential (II) images of the cell membrane surface of the untreated (A) and treated (B) HEK293H cells. The red arrows in (B (I)) point to two damage sites on the cell membrane. The same locations are circled in (B (II)). Height profiles are through the red dashed lines marked on the topography images. The potential distributions in (B (III)) with Gaussian fits (red solid lines) were generated from potential images (B (II)). (C) RMS surface roughness of treated and untreated cells. Treated vs untreated, “*” P < 0.05 with N = 4. (D) Mean surface potential of treated and untreated cells, Treated vs untreated, “n.s” P > 0.05 with N = 5. In all the SICM images, the scanning direction was from the top to the bottom.

