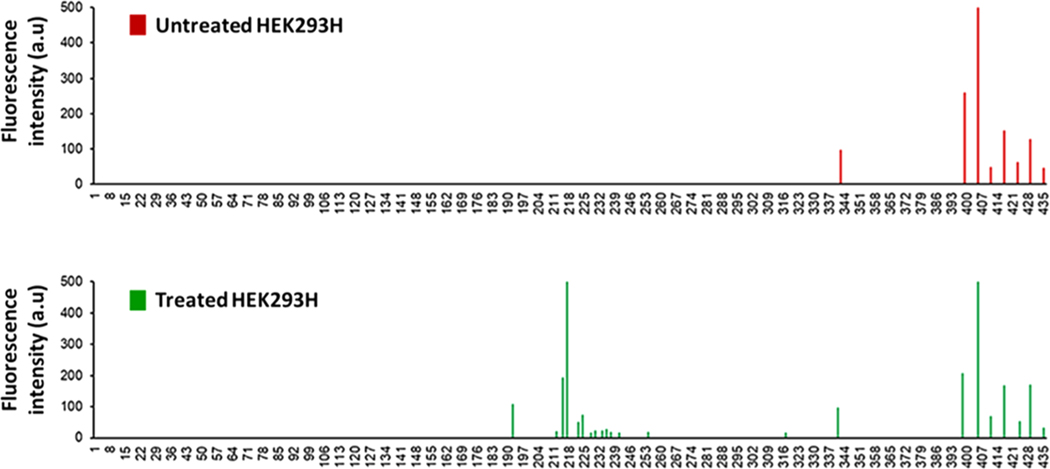
Figure 6.
Landscape profile of ssDNA breaks at the exon 4 of the β-actin gene in the untreated (top panel) and treated HEK293H cells (bottom panel). The peaks in the profiles represent ssDNA breaks located at a specific nucleotide at the exon 4 of the β-actin gene that are illustrated in the 5′ to 3′ direction counted from the initial nucleotide of the encoding sequence in the gene. The height of the peaks indicates the abundance of ssDNA breaks in the gene.

