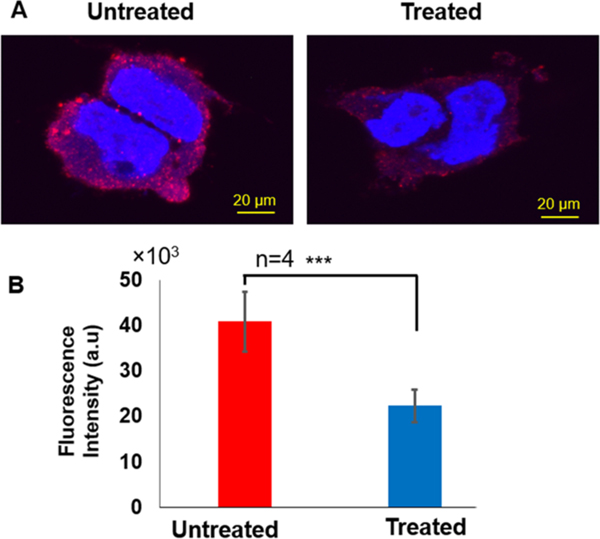
Figure 7.
Immunofluorescence staining of β-actin protein. (A) Immunofluorescence images for untreated (left) and treated (right) HEK293H cells. (B) The mean fluorescence intensity of β-actin protein in untreated (red bar graph) and treated (blue bar graph) HEK293H cells. There is a statistically significant difference between untreated and treated (“***” P < 0.001, n = 4). All experiments were performed in four biological replicates as described in Materials and Methods.

