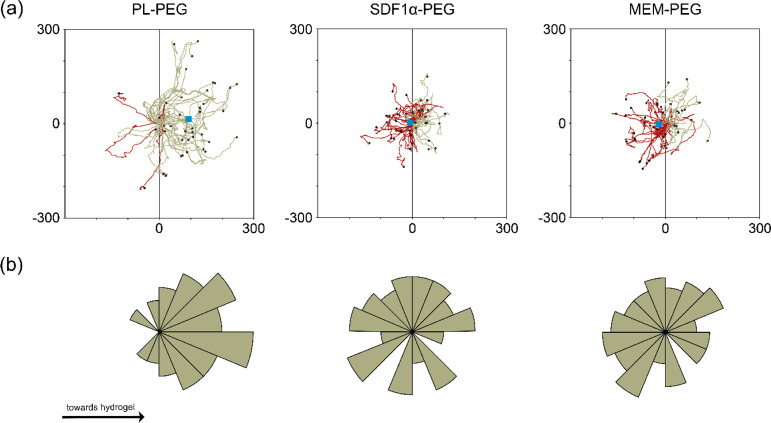
Figure 3.
(a) Individual cell trajectories of migrating cells when exposed to gels loaded with PL, SDF-1α, or MEM. The gray line across the x-axis (0,y) splits the circular positions to the left and right with 180° allocated to each direction. Red lines highlight directions adopted away (left) from the gel, while green lines indicate movements in the direction (right) of the loaded hydrogel. Blue boxes represent the center of mass at the end of the tracking. (b) Rose plots illustrating the distribution of the trajectories at distinct angle intervals. Further extension of segments away from the center represents a larger proportion of cells with endpoints within the defined angle. Additionally, Rayleigh tests were conducted for each hydrogel group to validate the homogeneity of the distribution across the circular plot.

