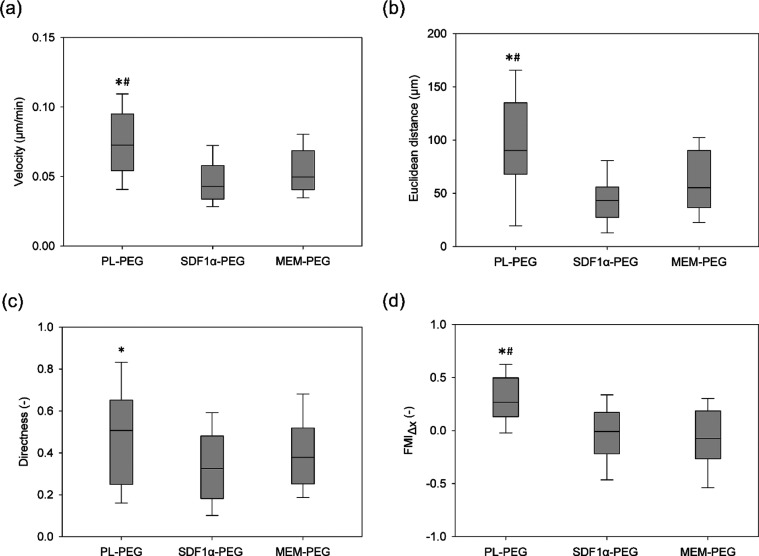
Figure 4.
Migration parameters quantified from cell trajectories. Velocity (displacement/time), Euclidean distance, directness (displacement/total path length), and the forward migration index (FMIΔx) toward the hydrogel were quantified (n = 40). The central line within the box plot represents the median, while the bottom and top whiskers indicate the 10th and 90th percentile, respectively. Cells exposed to PL hydrogels exhibited significantly higher velocities, while covering more distances in the direction of the hydrogel compared to those of SDF-1α (*)- and MEM (#)-loaded hydrogels (p ≤ 0.05).

