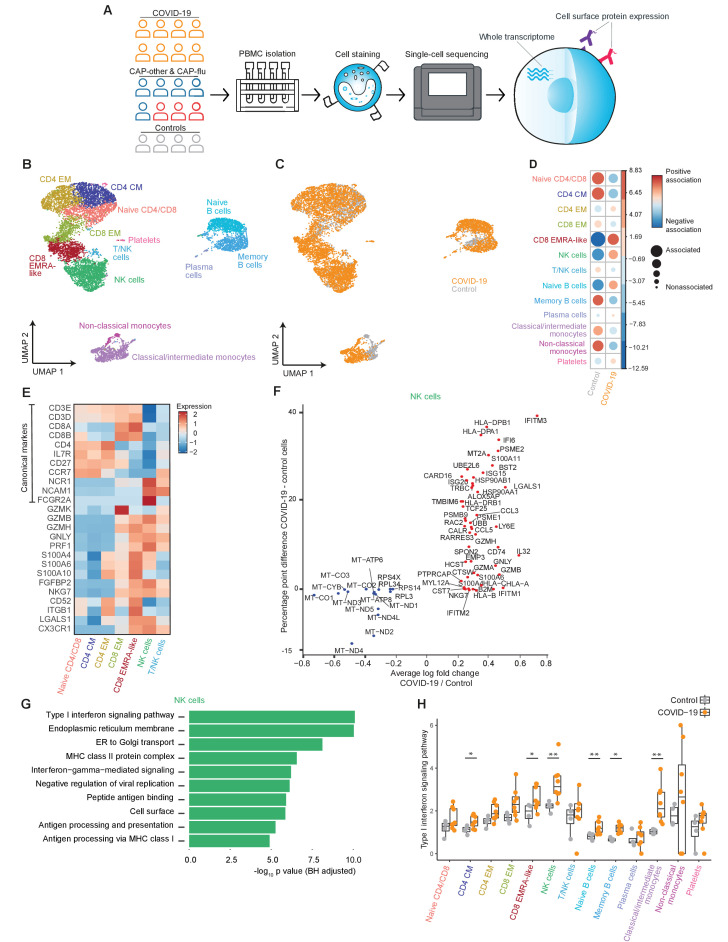
Figure 1. The immune response in COVID-19 is characterized by an expansion of CD8 EMRA-like T cells and type I interferon-stimulated NK cells, both demonstrating high cytotoxic potential.
(a) Experimental overview: PBMCs from a matched cohort of hospitalized patients with CAP caused by SARS-CoV-2 (COVID-19), CAP caused by Influenza A or other pathogens, and non-infectious controls, were isolated and stained with a panel of oligonucleotide-tagged antibodies. Single-cell mRNA and surface protein expression were subsequently measured on a 10x Genomics platform. (b, c) UMAPs depicting the clusters identified by the single-cell transcriptomic analysis of PBMCs from control subjects and patients with COVID-19, each dot representing a single cell. In the first UMAP (b), cells are colored by cell type cluster, whereas in the second UMAP (c), cells are colored by donor group. See also Figure 1—figure supplement 1. (d) Correlation plot depicting cluster enrichment in controls and COVID-19 patients. Dot size proportional to Pearson’s residual of the chi-squared test (i.e., reflecting the difference between the observed and expected proportion), while the color represents the degree of association from Pearson’s chi-squared residuals (red means a positive association, blue means a negative association). (e) Heatmap showing the expression of canonical genes and the top differentially expressed genes (DEGs) derived from comparing the CD8 EM and CD8 EMRA-like cell clusters (adjusted p<0.05). The heatmap also shows the expression of these genes in the other identified T and NK cell clusters. See also Figure 1—figure supplement 2. (f) Graph depicting the DEGs identified when comparing cells from COVID-19 patients and controls within the NK cell cluster. The X-axis depicts the average log fold change and the Y-axis depicts the percentage point difference between the proportion of cells expressing the gene in the COVID-19 group minus the proportion of cells expressing the gene in the control group. All depicted DEGs are statistically significant after adjusting for multiple testing (Benjamini-Hochberg). (g) Bar plot showing Gene Ontology pathway analysis of genes upregulated in NK cells from patients with COVID-19 (relative to controls) identified in the analysis in panel (g). The X-axis shows the Benjamini-Hochberg adjusted −log10 p-value from the enrichment score analysis. (h) Box and whisker plots showing the enrichment of the type I interferon pathway in all cell subsets, split between COVID-19 patients and controls. The Y-axis depicts the enrichment score. Statistical significance was determined using the two-sided Wilcoxon rank-sum test: *p<0.05, **p<0.01. CAP, community-acquired pneumonia; NK, natural killer; PBMC, peripheral blood mononuclear cell; UMAP, Uniform Manifold Approximation and Projection.


