. 2021 Aug 23;10:e69661. doi: 10.7554/eLife.69661

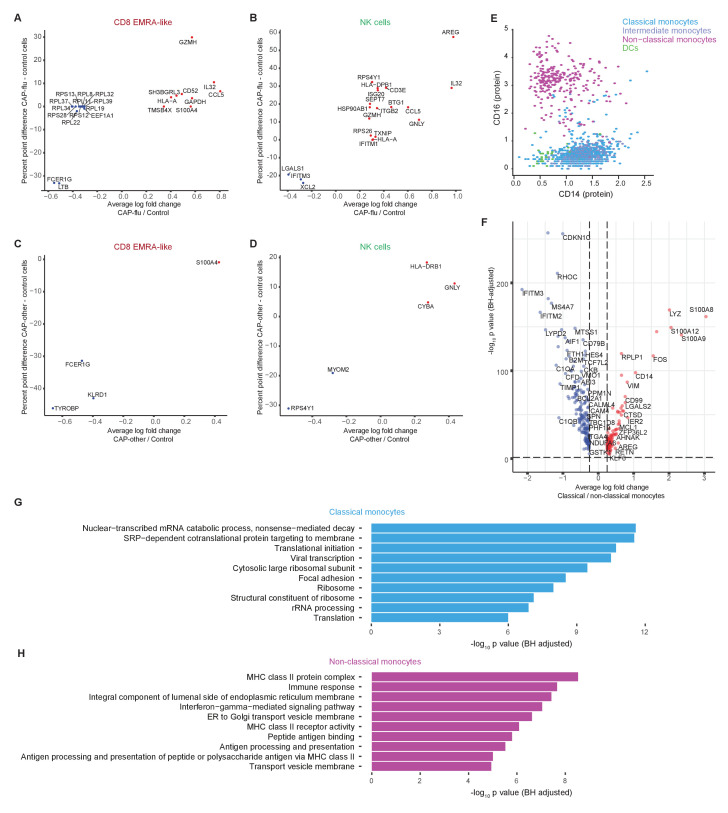
Figure 2. The peripheral immune features of T cells, NK cells, and monocytes vary between CAP-flu and CAP-other.

(a, b) UMAPs depicting the clusters identified by the single-cell transcriptomic analysis of PBMCs from controls, CAP-flu, and CAP-other patients, where each dot represents a single cell. In the first UMAP (a), cells are colored by cell type cluster, whereas in the second UMAP (b), cells are colored by donor group. See also Figure 2—figure supplement 1. (c) Correlation plot depicting cluster enrichment in controls, CAP-flu, and CAP-other patients. Dot size proportional to Pearson’s residual of the chi-squared test (i.e., reflecting the difference between the observed and expected proportion), while the color represents the degree of association from Pearson’s chi-squared residuals (red means a positive association, blue means a negative association). (c) Heatmap showing the expression of canonical genes and the top differentially expressed genes (DEGs) derived from comparing the CD8 EM and CD8 EMRA-like cell clusters (adjusted p<0.05). The heatmap also shows the expression of these genes in the other identified T and NK cell clusters. See also Figure 2—figure supplement 2. (e) Density plots showing the surface protein expression of CD38, CD33, CD11b, and CD11c per myeloid cell cluster. (f) Graph depicting the DEGs in the classical monocyte cluster when comparing CAP-flu patients versus controls. The X-axis depicts the average log fold change and the Y-axis depicts the percentage point difference between the proportion of cells expressing the gene in the CAP-flu group minus the proportion of cells expressing the gene in the control group. All depicted DEGs are statistically significant after adjusting for multiple testing (Benjamini-Hochberg [BH]). (g) Bar plot showing Gene Ontology pathway analysis of downregulated genes identified in the analysis in panel (g). The X-axis shows the BH adjusted −log10 p-value from the enrichment score analysis. (h) Boxplots depicting the downregulation of the MHC class II protein complex transcriptional pathway in naive B cells, memory B cells, classical monocytes, and non-classical monocytes clusters, split between controls, CAP-flu, and CAP-other patients. Statistical significance was determined using the two-sided Kruskal-Wallis test with post hoc pairwise Dunn’s test: *BH-adjusted p<0.05. (i) Density plot showing the normalized surface protein expression of HLA-DR on cells in naive B cells, memory B cells, classical monocytes, and non-classical monocytes clusters, split between controls, CAP-flu, and CAP-other patients. CAP, community-acquired pneumonia; NK, natural killer; PBMC, peripheral blood mononuclear cell; UMAP, Uniform Manifold Approximation and Projection.

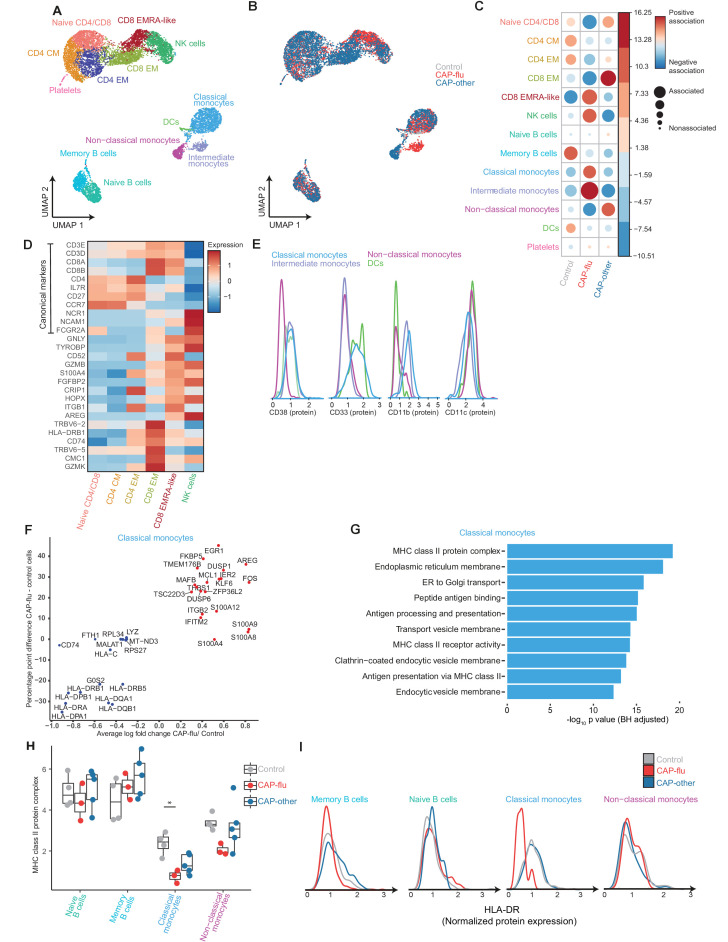
Figure 2.

Figure 2—figure supplement 1. mRNA, surface protein expression, and cell cluster distribution of controls, patients with CAP-flu, and patients with CAP-other.

Figure 2—figure supplement 1.

(a) Heatmap depicting mRNA expression of genes identified via differential expression analysis comparing the clusters identified by the single-cell transcriptomic analysis of PBMCs from control subjects, CAP-flu, and CAP-other patients. (b) Heatmap depicting surface protein expression of genes identified via differential expression analysis of protein markers comparing all cell clusters identified in panel (a). (C) UMAPs depicting the clusters identified by the single-cell transcriptomic analysis of PBMCs from control subjects, CAP-flu, and CAP-other patients, where each dot represents a single cell with the color corresponding to the normalized expression of each respective surface protein marker. (d) Stacked bar plots depicting the distribution of cell clusters per individual donor. The height of each rectangle represents the proportion of that cluster within each individual, whereas the surface area of each rectangle represents the proportion of the total number of cells from all donors combined. CAP, community-acquired pneumonia; PBMC, peripheral blood mononuclear cell; UMAP, Uniform Manifold Approximation and Projection.
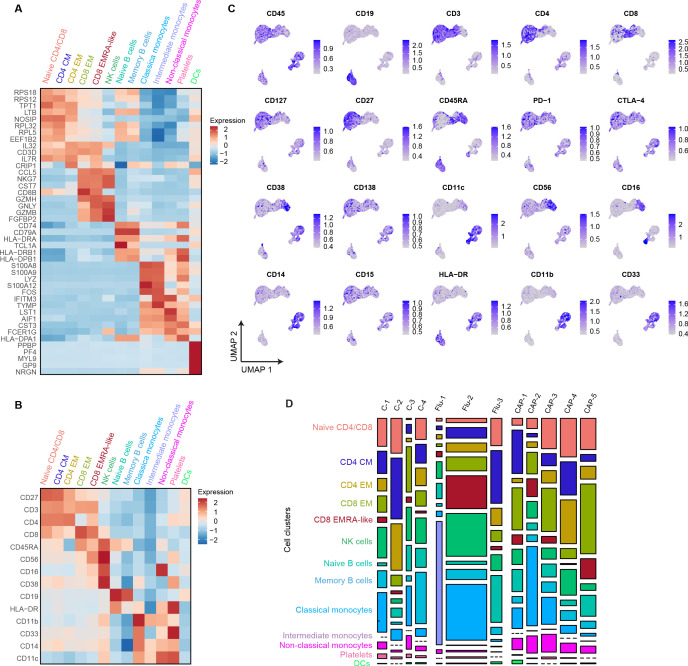
Figure 2—figure supplement 2. Differentially expressed genes of T cell, NK cell, and monocyte clusters between patients with CAP-flu, CAP-other, and control subjects.

Figure 2—figure supplement 2.

(a, b) Dot plot depicting the differentially expressed genes (adjusted p<0.05) between PBMCs from CAP-flu patients and control subjects present in the CD8 EMRA-like cell cluster (a) or NK cell cluster (b). (c, d) Dot plot depicting the differentially expressed genes (adjusted p<0.05) between PBMCs from CAP-other patients versus control subjects present in the activated T cell cluster (c) or NK cell cluster (d). In panels (a–d), the X-axis depicts the average log fold change and Y-axis depicts the percentage point difference between the proportion of cells expressing the gene in the CAP-other or CAP-flu group minus the proportion of cells expressing the gene in the control group. (e) Scatterplot depicting CD14 and CD16 normalized surface protein expression for each monocyte cluster and dendritic cells. (f) Volcano plot depicting the average log fold change gene expression between classical and non-classical monocytes on the X-axis and the −log10 of the Benjamini-Hochberg adjusted p-value on the Y-axis. Only genes with an adjusted p-value<0.05 and log fold change>0.25 are depicted. Red dots represent genes upregulated in classical monocytes, blue dots represent genes upregulated in non-classical monocytes. (g, h) Bar plots depicting Gene Ontology pathways enriched from the differentially expressed classical monocyte genes (g) and non-classical monocyte genes (h) identified in the analysis in panel (f). The X-axis shows the Benjamini-Hochberg adjusted −log10 p-value from the enrichment score analysis. CAP, community-acquired pneumonia; NK, natural killer; PBMC, peripheral blood mononuclear cell.