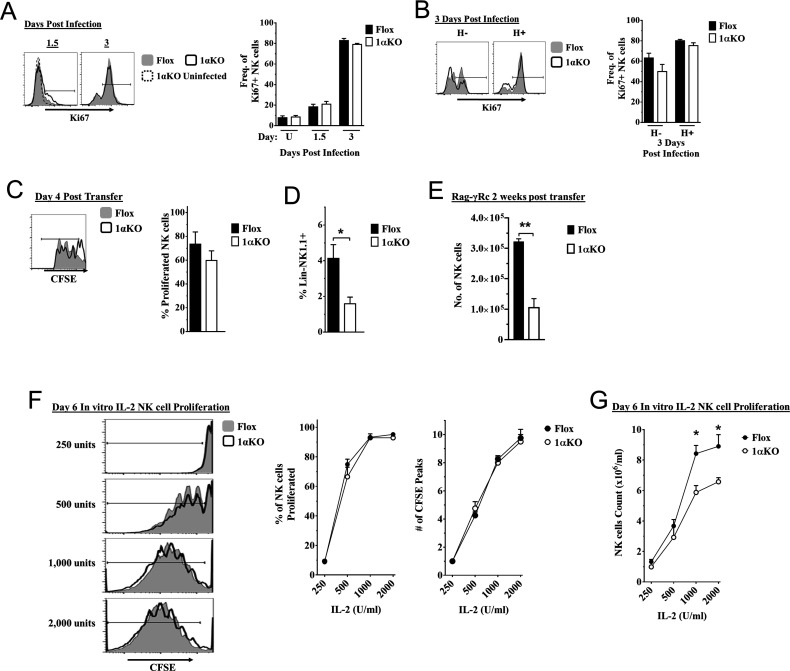
Figure 4. Cell division in hypoxia-inducible factor-1α (HIF1α) KO natural killer (NK) cells is normal but numbers are reduced.
(A, B) 1αKO or FL control mice infected with murine cytomegalovirus (MCMV) received a dose of 50K plaque forming unit (pfu) and analyzed as indicated. (A) Ki67 expression with representative histograms (left) and frequency quantification (right) in 1αKO or FL control bulk NK cells at day 1.5 and day 3 post-infection (pi). Data are from three independent experiments with 5–7 mice per group. (B) Expression of Ki67 in Ly49H negative and positive NK cells shown in histogram (left) and frequencies quantified (right). Data are from two independent experiments with three mice per group. (C, D) Rag-γRc mice analyzed for CFSE + splenic NK cells from 1αKO or FL control mice 4 days post transfer, showing representative histogram (C, left) and quantification of total proliferation (C, right), and frequencies (D). Data are from two independent experiments with four mice per group. (E) Rag-γRc mice analyzed on day 14 since post splenocyte transfer for numbers of NK cells in the spleen from 1αKO or FL control mice. Data are from two independent experiments with three mice per group. (F, G) In vitro proliferation assays were done using human recombinant IL-2 at different concentrations and time points indicated below. (F) Representative histograms (left), quantification of total proliferated cells (middle), and number of CFSE peaks (right) of CFSE labeled NK cells from 1αKO or FL control mice stimulated with different concentrations of IL-2 for 6 days. (G) Numbers of NK cells were counted from (F) and graphed in cells per 1 ml. Data are from two independent experiments with four mice per group. Data depict mean ± SEM, with each data set containing data indicated number of mice per group from independent experiments. Unpaired t-test was performed on (A–G). Statistical significance indicated by n.s., no significant difference; *p<0.05; **p<0.01; ***p<0.001; ****p<0.0001.


