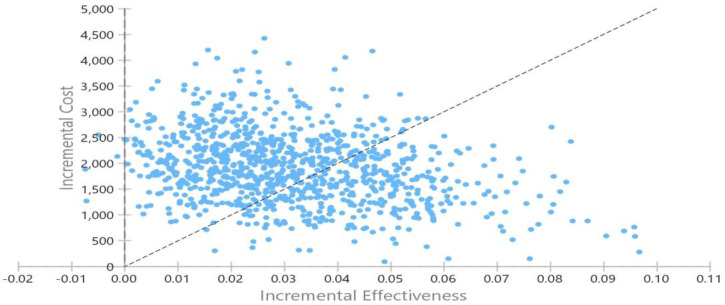
Figure 7: Scatter Plot of Simulated Pairs of Incremental Costs and Effects in the Cost-Effectiveness Plane—Multi-gene Pharmacogenomic-Guided Treatment Versus Treatment as Usual.
Note: Effectiveness is expressed in quality-adjusted life years (QALYs). Negative QALYs indicate that intervention was associated with worse quality-adjusted survival. Diagonal dashed line that crosses the origin indicates a willingness-to-pay value of $50,000 per QALY gained.

