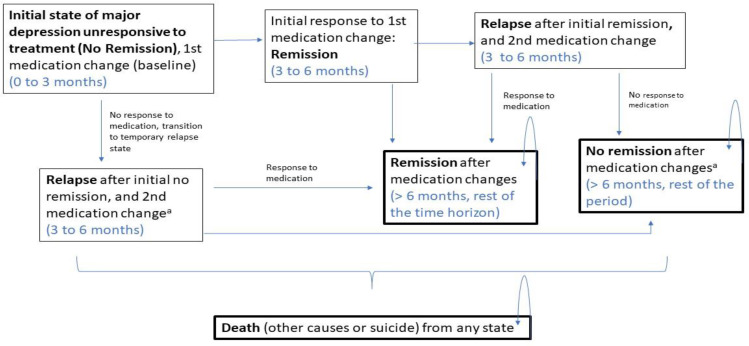
Figure A1: Markov Model Schematic—Reference Case.
Note: This figure depicts our 1-year Markov state-transition model for the reference case, which gives a possibility of having a sequence of two medication trials: a first (initial) medication change occurs at baseline; a second medication change is made after relapse. The model includes 7 health states, of which 4 are temporary, represented by a solid rectangle without an arrow. The other 3 health states (remission, no remission, or death) are permanent, represented by a dotted rectangle with an arrow. The temporary health states (initially no remission, initial remission, and relapse after no remission at baseline or after initial remission) indicate that a person remains in those states for a certain period, depicted by blue text on the figure (e.g., 3–6 months); after that period, one must transition toward one of the permanent health states.
a At the relapse state, the second change of medication is modeled; according to treatment pathway (see Figure 5), about 3 months are needed for evaluation of the response to medication, and subsequent transition to more permanent states of remission or no remission.

