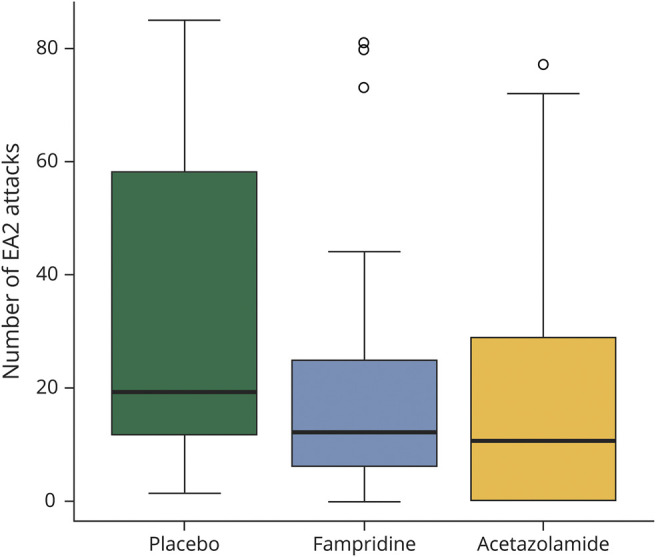
Figure 2. Number of EA2 Attacks Within the Last 30 Days of a 12-Week Treatment Period (Primary Efficacy Outcome Measure).

The number of attacks was determined according to the patients' diaries. Boxplots for outcome measures during the placebo, fampridine, and acetazolamide treatment phases (box-whisker plot with 25% and 75% percentiles [borders of the boxes], the median [line], whiskers [extend to the most extreme data point, which is no more than 1.5 times the interquartile range from the box], and outliers).
