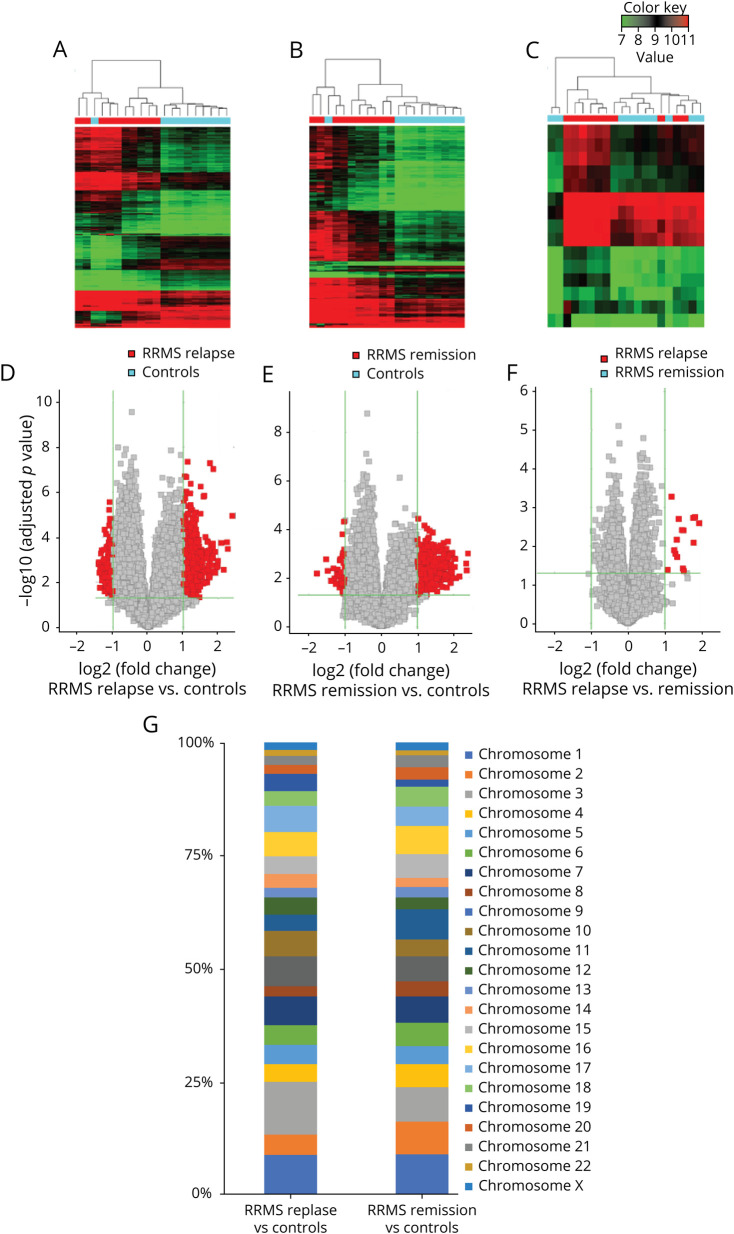
Figure 1. circRNA Profile in RRMS.
Heatmaps show differentially expressed circRNAs from unsupervised hierarchical clustering present in the PBMCs of patients with RRMS relapse vs controls (A), RRMS remission versus controls (B), and RRMS relapse versus remission (C). Color key represents Z score values; the raw data displayed as a heatmaps are present in Supplementary file, links.lww.com/NXI/A538. Volcano plot graphs for circRNA expression levels in the PBMCs of RRMS relapse vs controls (D), RRMS remission versus controls (E), and RRMS relapse versus remission (F). The vertical green lines correspond to upregulation and downregulation >2-fold. The horizontal green line represents an adjusted p value of 0.05. The red squares indicate differentially expressed circRNAs with statistical significance. (G) Chromosomal distribution of significantly differentially expressed circRNAs in RRMS relapse and RRMS remission versus controls. circRNA= circular RNA; PBMCs = peripheral blood mononuclear cells; RRMS = relapsing-remitting multiple sclerosis.

