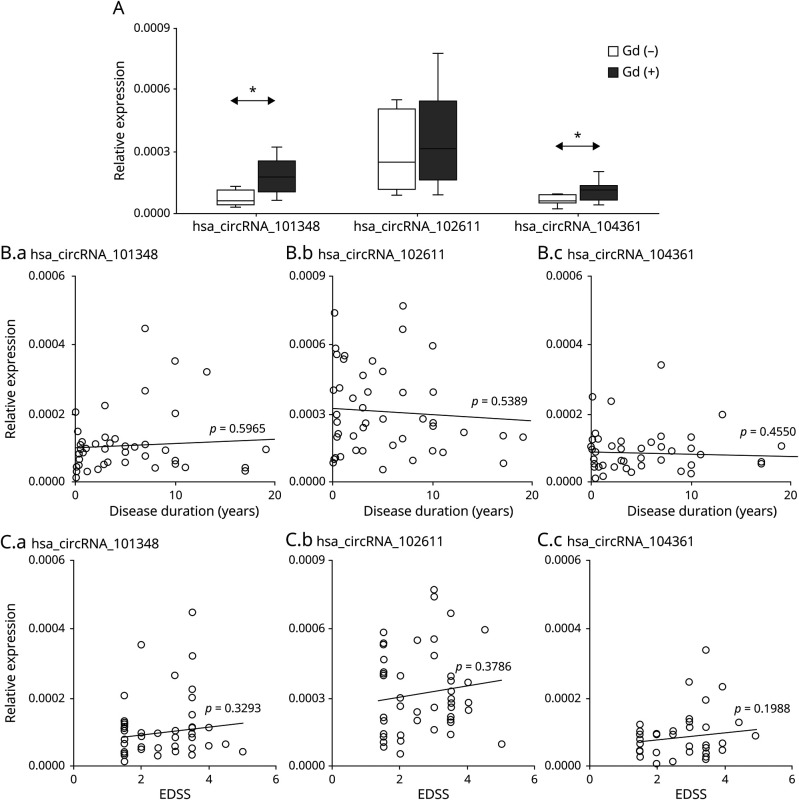
Figure 3. circRNA Expression in PBMC is Increased in Relation to Magnetic Resonance Imaging Activity in RRMS.
(A) Box and whisker plots of relative expression of indicated circRNA in PBMCs in gadolinium-enhanced (Gd)+ (n = 11) and in (Gd)− (n =13) patients with RRMS. Significance was determined by the Student t test. *p < 0.05. PBMCs (B.a) hsa_circRNA_101348, (B.b) hsa_circRNA_102611, and (B.c) hsa_circRNA_104361 expression levels were plotted against disease duration. Circles represent individual data, and the line represents a correlation trend; p values were calculated by R2 statistic. PBMCs (C.a) hsa_circRNA_101348, (C.b) hsa_circRNA_102611, and (C.c) hsa_circRNA_104361 expression levels were plotted against EDSS. Circles represent individual data, and the line represents a correlation trend; p values were calculated by R2 statistics. circRNA = circular RNA; EDSS = expanded disability severity scale; PBMCs = peripheral blood mononuclear cells; RRMS = relapsing-remitting multiple sclerosis.

