Figure 3.

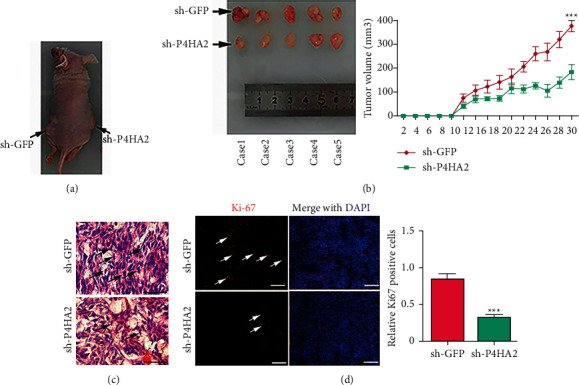
Knockdown of P4HA2 suppressed tumor xenograft growth in vivo. (a) Xenograft tumors were generated by subcutaneously implanting P4HA2 control and P4HA2 knockdown U87MG cells on either side of nude mice. (b) Photographs represented removed tumor bulks from two groups of animals (left). Tumor volume was compared between groups at indicated days (right); ∗∗∗p < 0.001. (c) H&E staining of xenograft tumor tissues. Bar = 25 μm. (d) Immunofluorescence images showed expression levels of Ki-67 (red) in P4HA2 control tumors and P4HA2 knockdown tumors. DAPI (blue) was used to stain nuclei (left, scale bar = 100 μm). Statistical comparison of the relative Ki-67 expression between groups was shown on the right; ∗∗∗p < 0.001.
