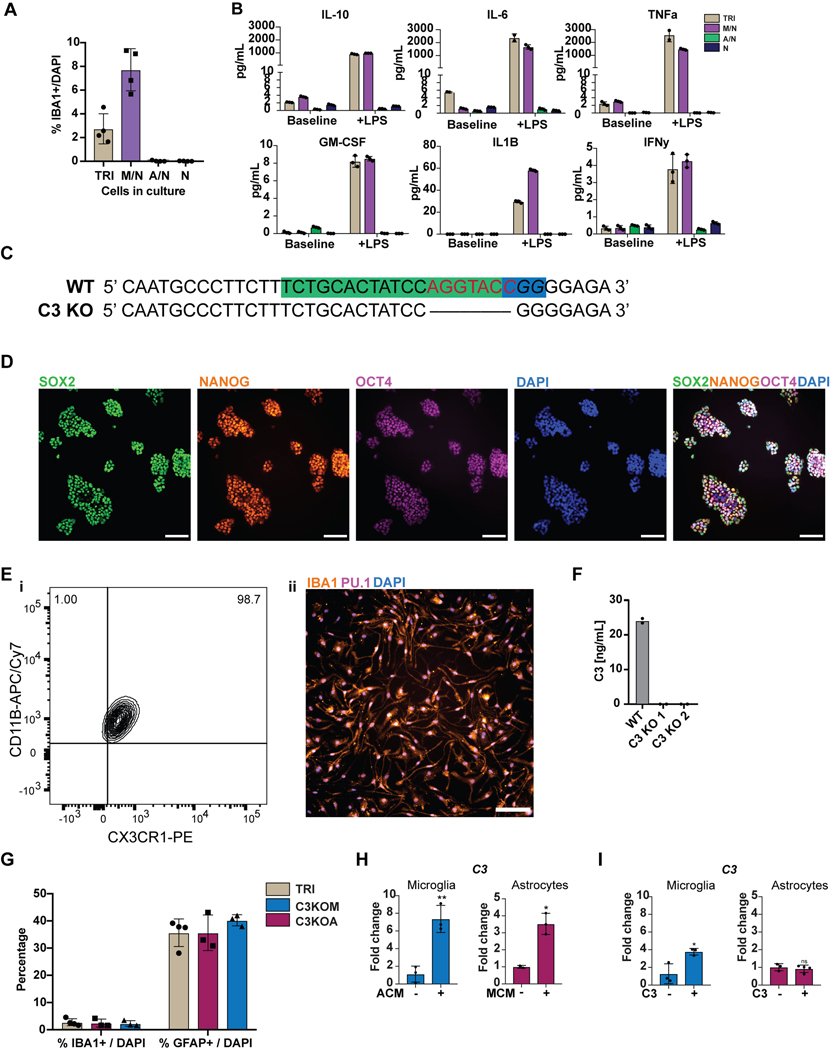
Extended Data Fig. 9. Characterization of C3KO hPSC line and C3KO-derived microglia and activation properties of conditioned medium and C3 addition to microglia and astrocytes.
A) Cell scoring by ImageExpress microscopy shows higher %IBA1+ / DAPI in microglia/neuron (M/N) cultures vs. tri-cultures at day 7. n=4 distinct cell culture wells. Error bars = SD, center = mean. B) Cytokine ELISA panel shows the secretion of inflammatory cytokines upon LPS stimulation only in cultures containing microglia, including IL-10, IL-6, TNFa, GM-CSF, IL1B, and IFNy. n=3 cell culture supernatants. Error bars = SD, center = mean. C) Sanger sequencing shows that the C3 KO hPSC line has a 7bp deletion (red) near the targeted PAM site (blue), guide is marked in green. D) IF shows that the C3KO hPSC line expresses the pluripotency markers of SOX2, NANOG, and OCT4. Scale bar = 100μM. E) i) FACS analysis shows that microglia differentiated from the C3KO line are a pure population expressing CD11B+ and CX3CR1+. ii) IF shows that these cells are all IBA1+ and PU.1+. Scale bar = 100μM. F) ELISA shows that C3KO microglia (densely cultured alone) do not secrete C3 protein as compared to WT microglia. n=2 cell culture supernatants. G) Cell scoring by ImageExpress shows similar numbers of IBA1+ microglia and GFAP+ astrocytes between the different tri-cultures (TRI, C3KOM, C3KOA). n= 4 distinct cell culture wells. Error bars = SD, center = mean. H) 48hrs of astrocyte-conditioned medium (ACM) treatment induces C3 expression in hPSC-derived microglia, normalized to untreated microglia. **p=0.0037, two-tailed t-test, n=3. 48 hrs of microglia-conditioned medium (MCM) treatment induces C3 in astrocytes, normalized to untreated astrocytes, n=3 independent experiments. *p=0.0122, two-tailed t-test. Error bars = SD, center = mean. I) C3 (1ug/mL) addition to microglia induces C3 expression after 48 hr, normalized to untreated microglia. *p=0.0217, two-tailed t-test, n=3 independent experiments. C3 addition to astrocytes does not induce C3 expression after 48hr of treatment, n=3. Error bars = SD, center = mean.

