
Figure 1.
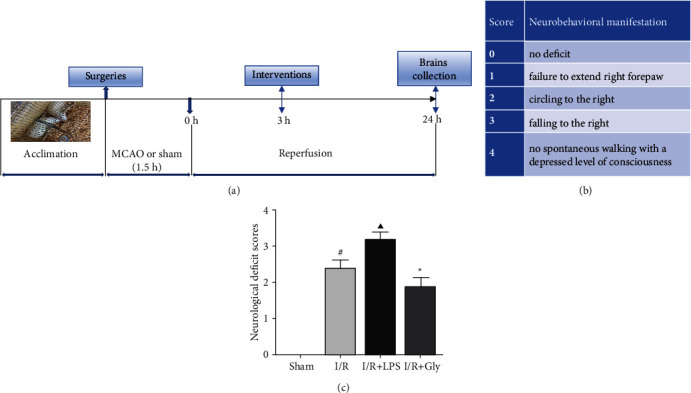
(a) Schematic diagram of the experimental protocol. (b) Longa's score and corresponding neurobehavioral manifestation. (c) Neurological deficit scores of each group according to Longa's score method, n = 10. Data are presented as mean ± SD.#P < 0.05, I/R group versus sham group; ▲P < 0.05, I/R + LPS group versus I/R group; ∗P < 0.05, I/R + Gly group versus I/R group.