
Figure 2.
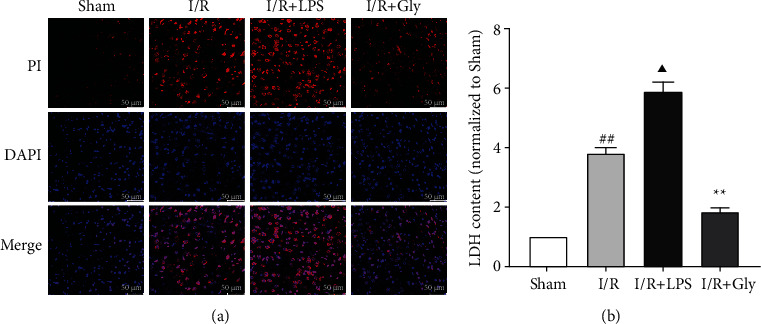
Effects of LPS and Gly interventions on the degree of pyroptosis at 24 h after reperfusion. (a) Representative pictures of PI staining, the red dots represent positive PI staining; scale bars, 50 μm. (b) Relevant quantitative analysis of LDH content, n = 4. Data are presented as mean ± SD. ##P < 0.01, I/R group versus sham group; ▲P < 0.05, I/R + LPS group versus I/R group; ∗∗P < 0.01, I/R + Gly group versus I/R group.