
Figure 3.
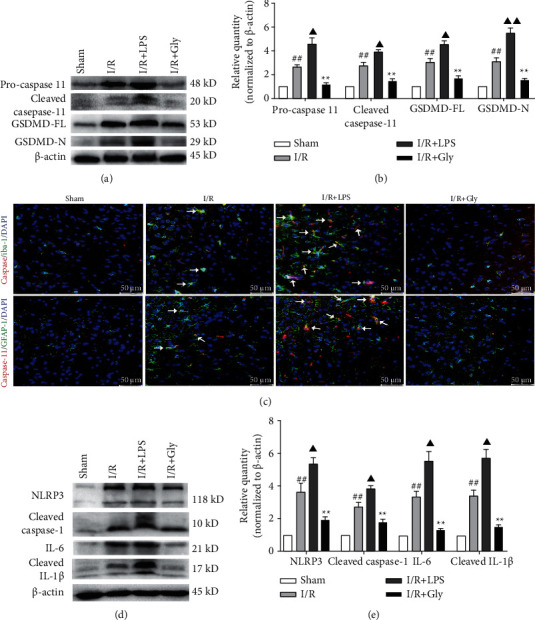
Effects of LPS and Gly interventions on expression levels of pyroptosis-related proteins and observations of pyroptosis locations. (a, b) Expression levels of pro-/cleaved caspase-11 and GSDMD-FL/N by Western blotting analysis, n = 6. (c) Representative pictures of the double immunofluorescence staining (white arrows) of caspase-11 (red) colocalized with Iba-1 or GFAP (green), respectively, scale bars, 50 μm. (d, e) Expression levels of NLRP3, cleaved caspase-1, IL-6, and cleaved IL-1β, n = 6. Data are presented as mean ± SD. ##P < 0.01, I/R group versus sham group; ▲P < 0.05, ▲▲P < 0.01, I/R + LPS group versus I/R group; ∗∗P < 0.01, I/R + Gly group versus I/R group.