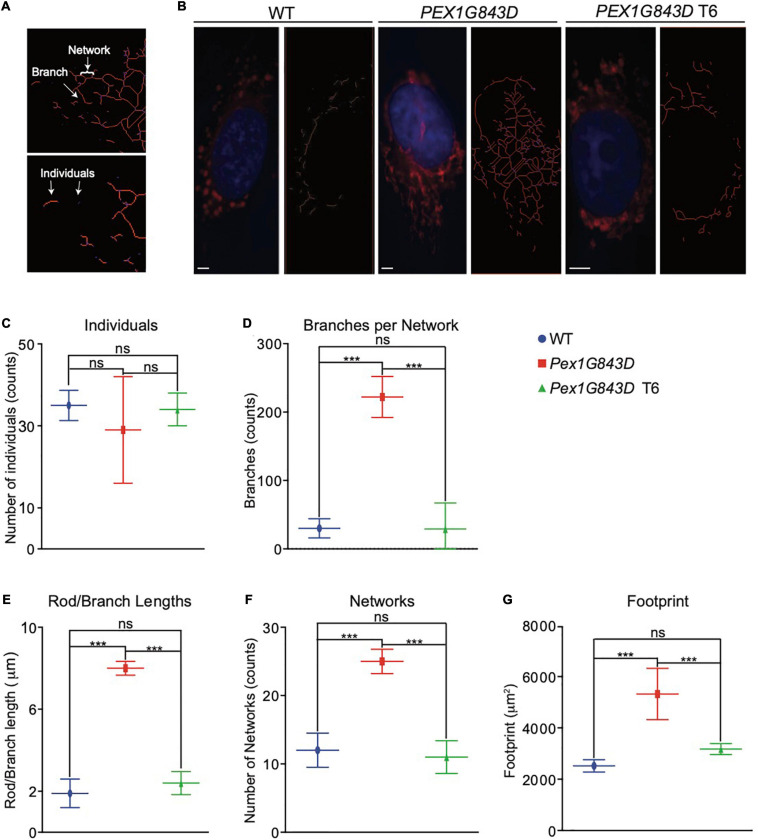
FIGURE 4.
T6 treatment restores the mitochondrial compartment in PEX1G843D fibroblasts. (A) Mitochondria were stained by MitoTracker Red and observed by fluorescence microscopy. Examples of the two types of mitochondrial features, individuals and networks, recognized by MiNA are shown. Networks can have different numbers of branches. (B) Fluorescence images of MitoTracker Red-stained WT fibroblasts, PEX1G843D mutant fibroblasts, and T6-treated PEX1G843D fibroblasts. The image at right in each pair of images shows skeletonized mitochondria required for analysis by MiNA. DNA was stained with DAPI. Red, mitochondria. Blue, nuclei. Scale bars, 10 μm. Histograms reporting the number of individuals (C), mean branches per network (D), mean rod to branch length (E), number of networks (F), and footprint area per cell (G) obtained by MiNA for WT fibroblasts, PEX1G843D mutant fibroblasts, and T6-treated PEX1G843D fibroblasts. Error bars represent standard deviation (N = 25). Statistical significance was calculated using 1-way ANOVA. ***p < 0.001. ns, not significant.

