
Fig. 2.
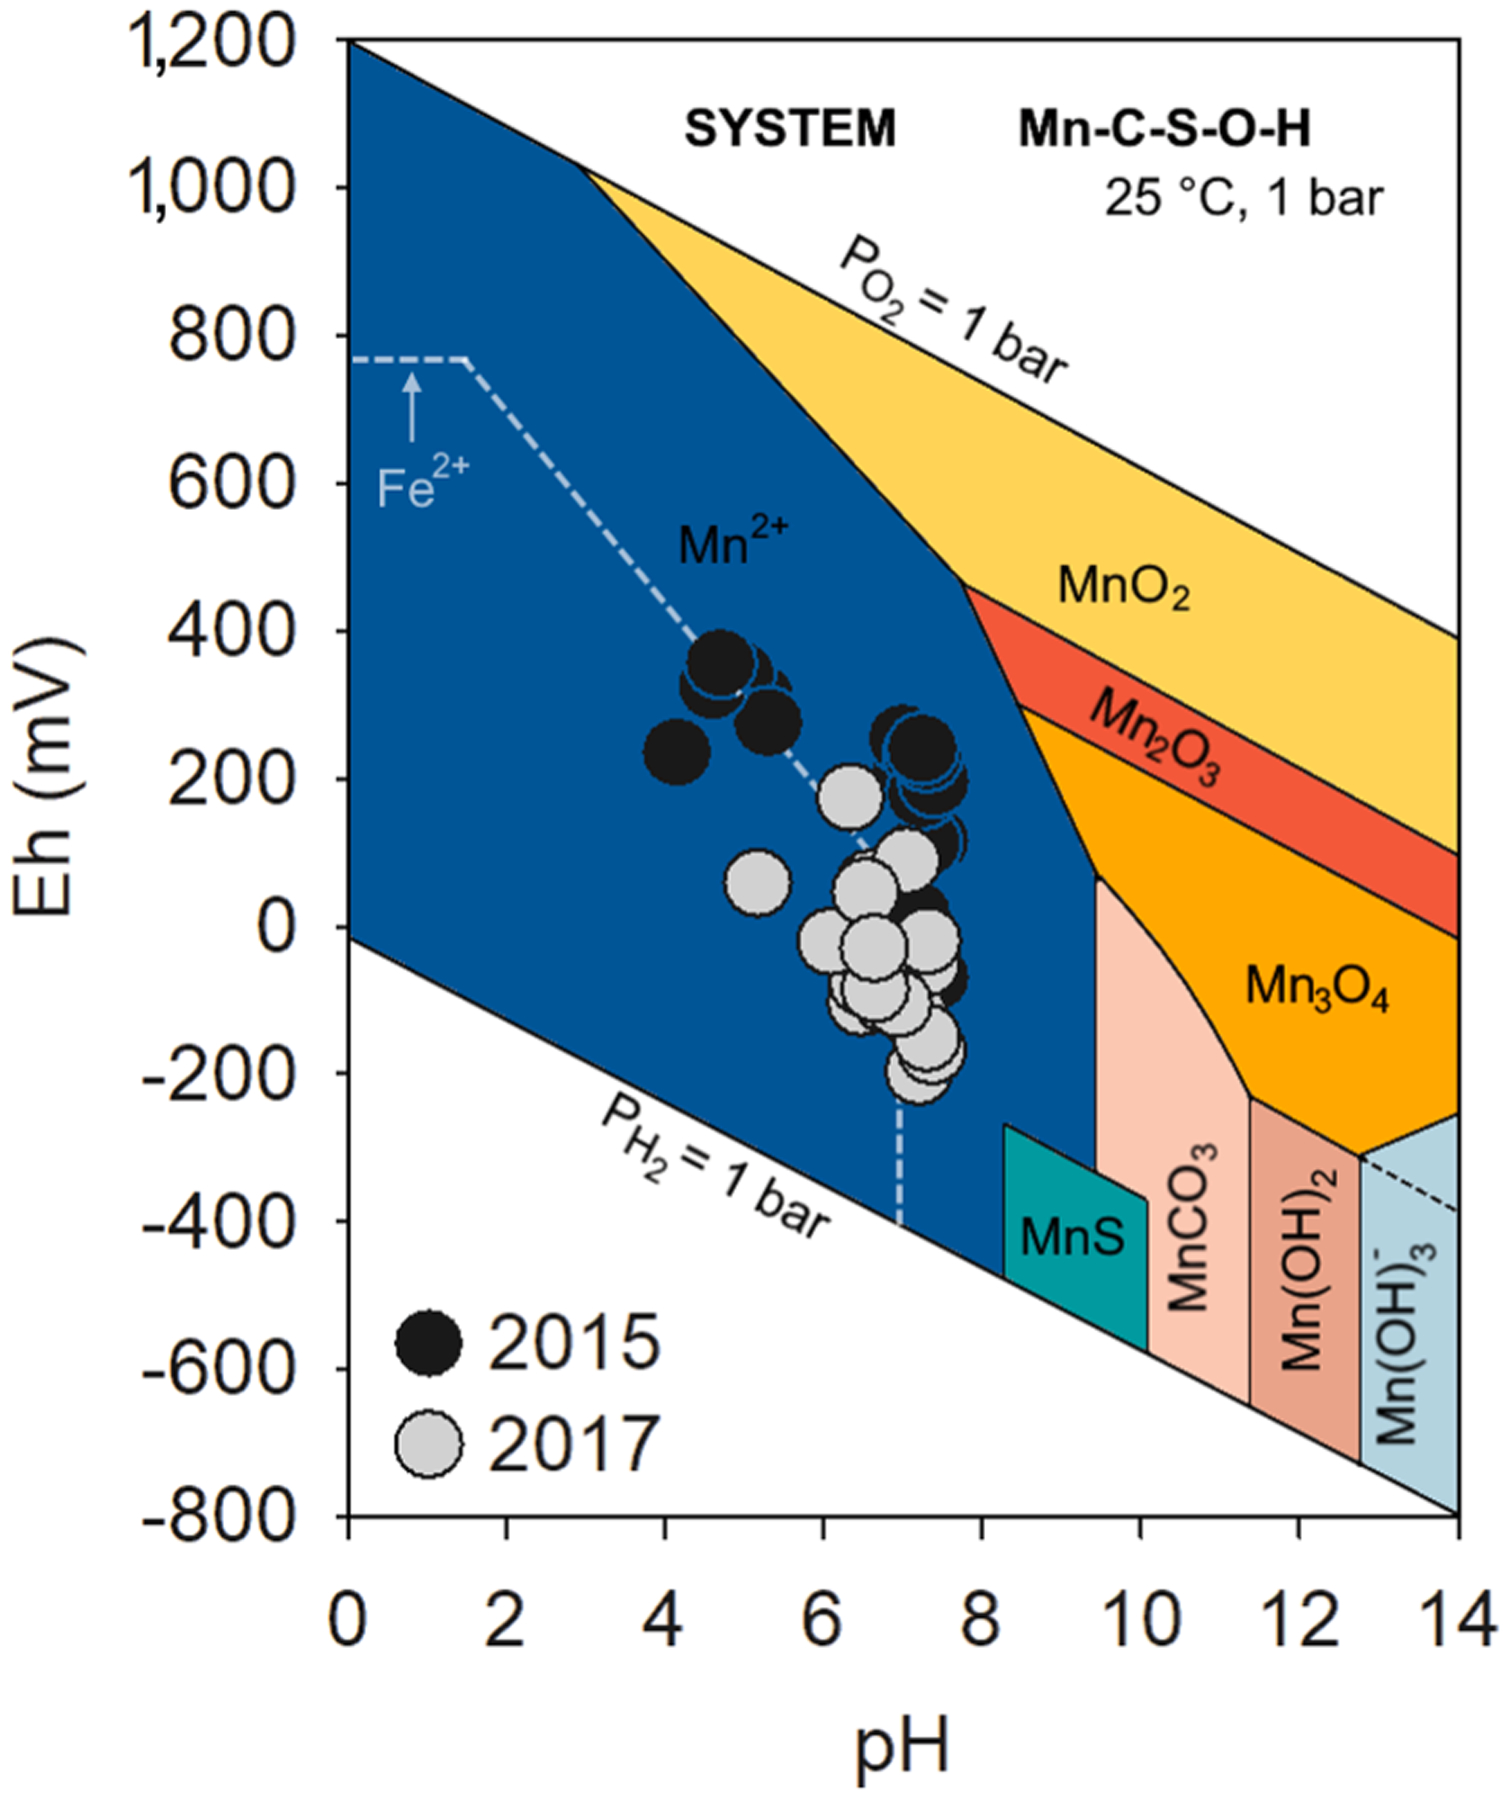
Eh-pH diagram (system Mn-C-S-O-H) with the data for the studied soils in both years. The gray dashed line indicates the Fe2+ stability field on the system Fe-C-O-H. The Eh-pH diagram was adapted from Brookins (1988).
Official websites use .gov
A
.gov website belongs to an official
government organization in the United States.
Secure .gov websites use HTTPS
A lock (
) or https:// means you've safely
connected to the .gov website. Share sensitive
information only on official, secure websites.
Eh-pH diagram (system Mn-C-S-O-H) with the data for the studied soils in both years. The gray dashed line indicates the Fe2+ stability field on the system Fe-C-O-H. The Eh-pH diagram was adapted from Brookins (1988).