
Fig. 6.
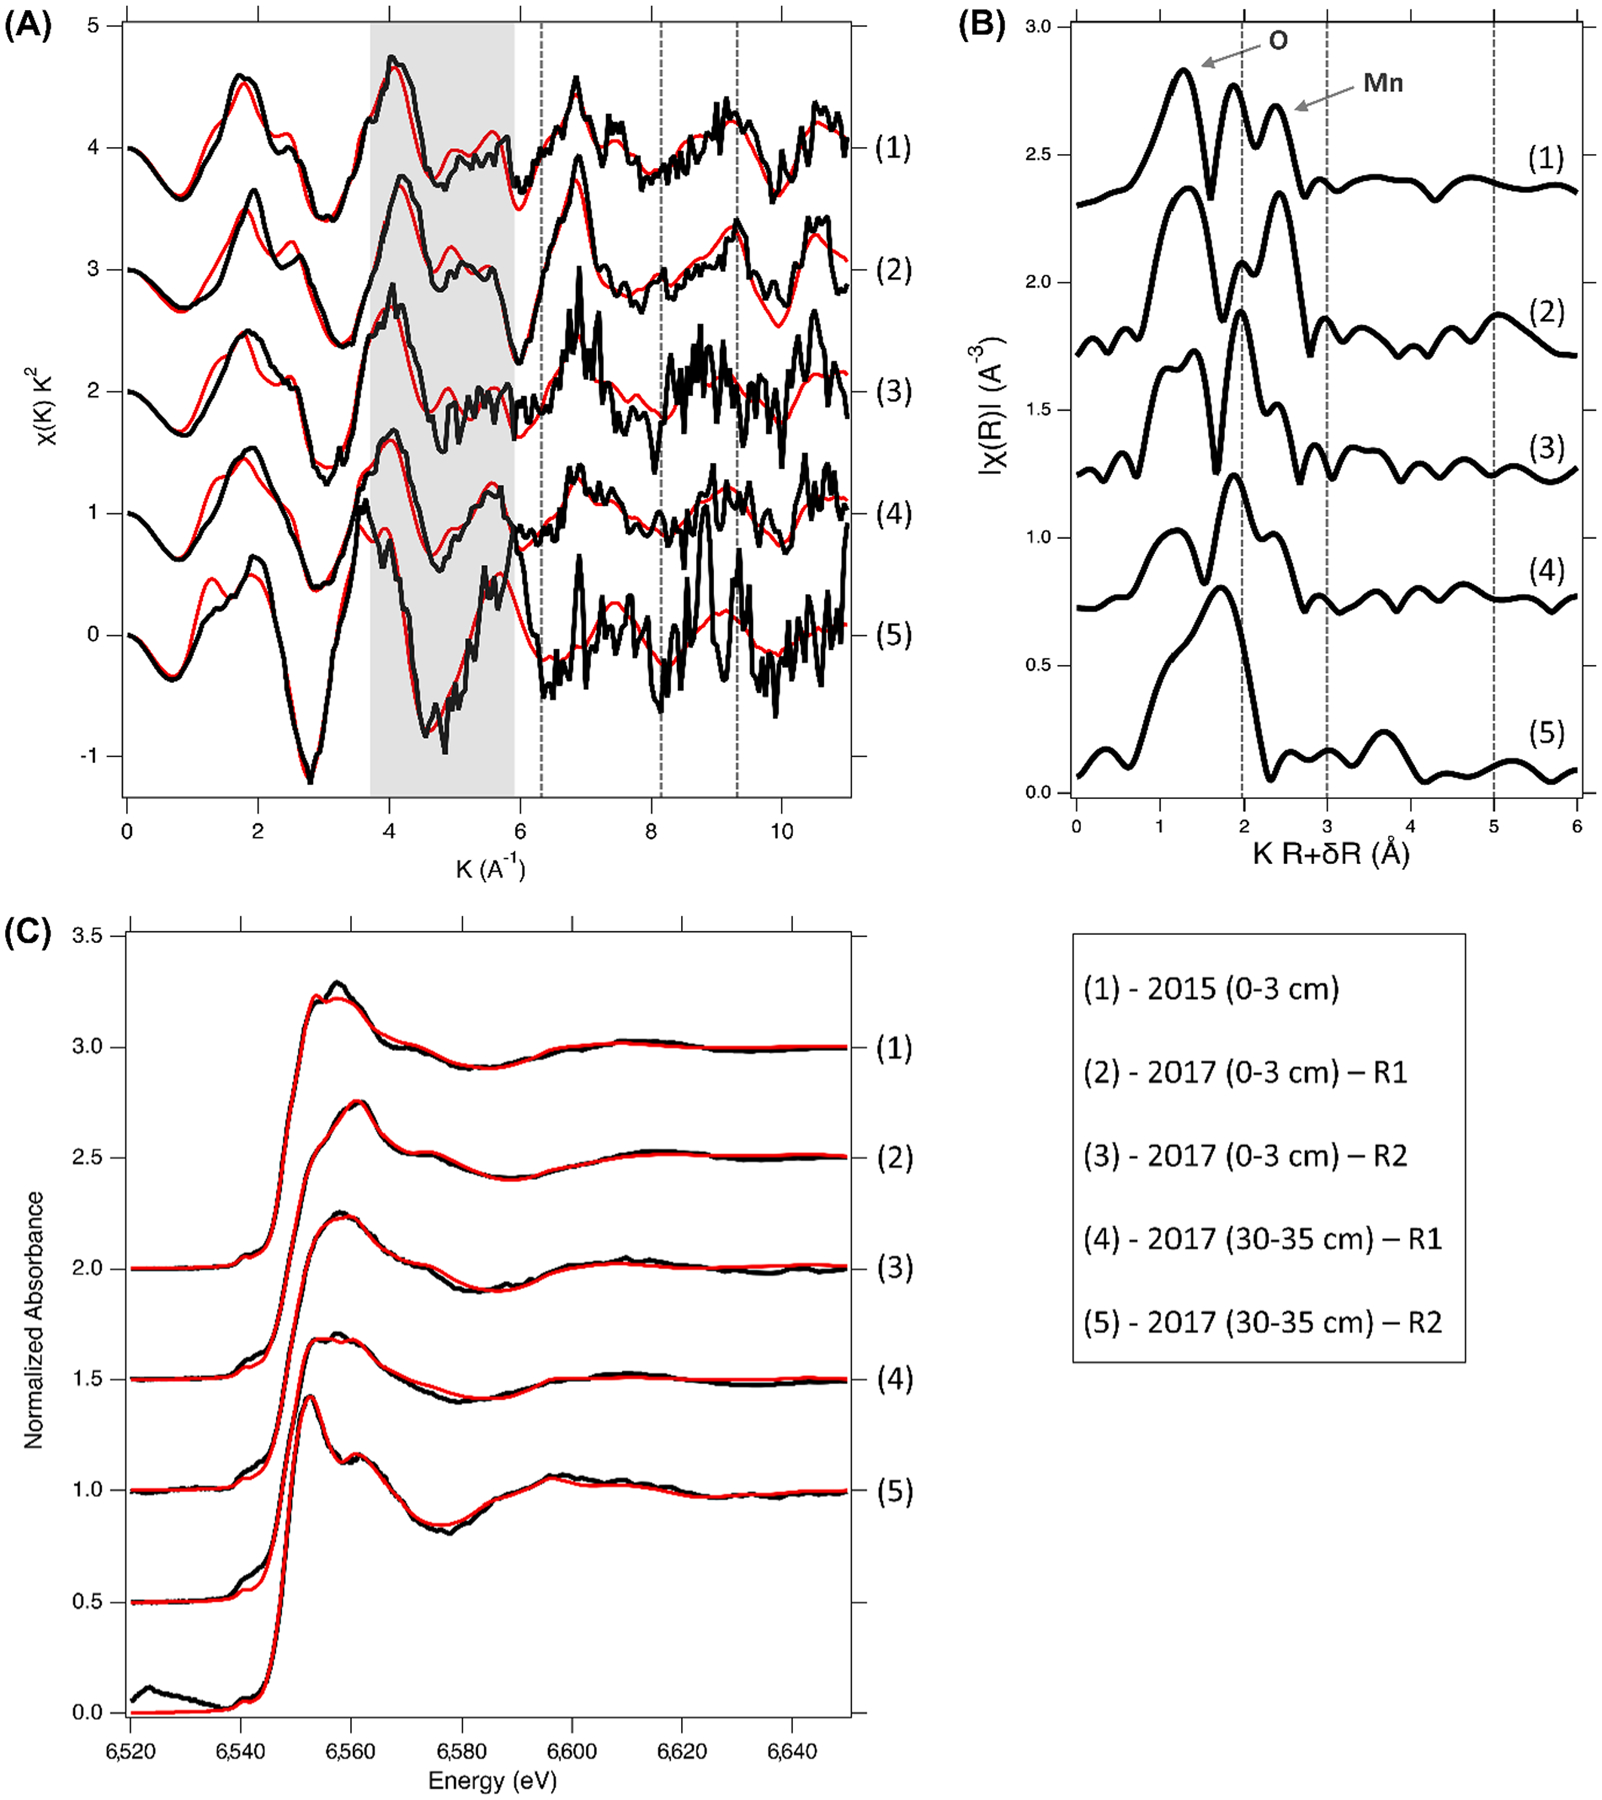
Mn K-edge EXAFS of soil samples from 2015 and 2017 collected at two depths (0–3 cm and 30–35 cm). (A) Shaded area highlights the characteristic “staircase” feature of the EXAFS indicative of phyllomanganate presence; the vertical dashed lines mark the shoulder feature at 6.5 Å−1 and the antinodes at 8.2 and 9 Å−1. (B) Pseudo-radial structure functions of the Mn EXAFS; vertical lines mark features at 2 Å, 3 Å and 5 Å; the arrows point to the nearest Mn-O and Mn-Mn shells. (C) A comparison of the Mn XANES from 2017 soil samples with the soil surface sample from 2015. Data is shown in black, model generated from linear combination fitting is shown in red.