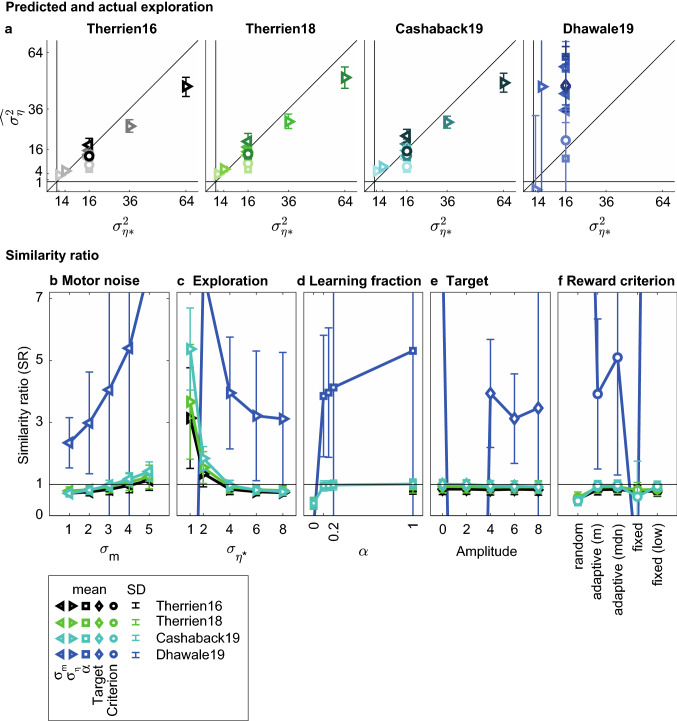
Fig. 5.
Exploration estimated by the TTC method. Means and standard deviations have been calculated per simulation set of 1000 simulations for the four learning models. Colors indicate the learning model, symbols the parameter that is varied: variance of motor noise () and exploration (), learning parameter (α), target amplitude and reward criterion. For the Dhawale19 model, various simulations resulted in values outside the plotted range; error bars have only been plotted when the mean was within the axis range. a TTC estimates of exploration () as a function of input exploration (). The diagonals indicate the unity line, at which estimates are perfect. Note that most simulations have been run with the default exploration . b-f Similarity ratio () as a function of the parameters varied. Horizontal lines at SR = 1 indicate perfect estimation

