Fig. 2.
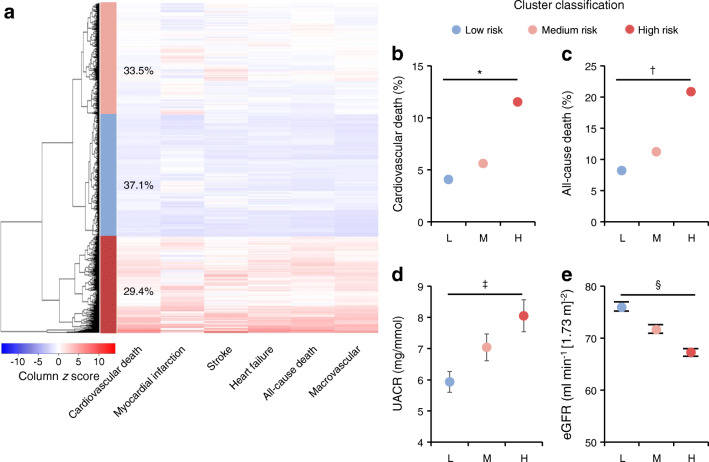
(a–e) Clustering of combined macrovascular disease risk by multiPRS using unsupervised hierarchical clustering algorithm. This clustering method identified three main clusters of individuals with low (blue; L), medium (pink; M) or high (red; H) combined macrovascular risk representing 37.1%, 33.5% and 29.4%, respectively, of ADVANCE participants. (a) The multiPRS values for each participant and each outcome are represented by z score (blue colour: negative score, red colour: positive score) in the heat map. (b, c) The incidence (%) of cardiovascular (*p = 1.5 × 10⁻¹³) (b) and all-cause death (†p = 1.8 × 10⁻²¹) (c) were compared between the high and the low clusters. (d, e) Differences in UACR (‡p = 1 × 10⁻⁴) (d) and eGFR (§p = 2 × 10−44) (e) values were determined between the high and the low clusters. eGFR is based on CKD-EPI formula

