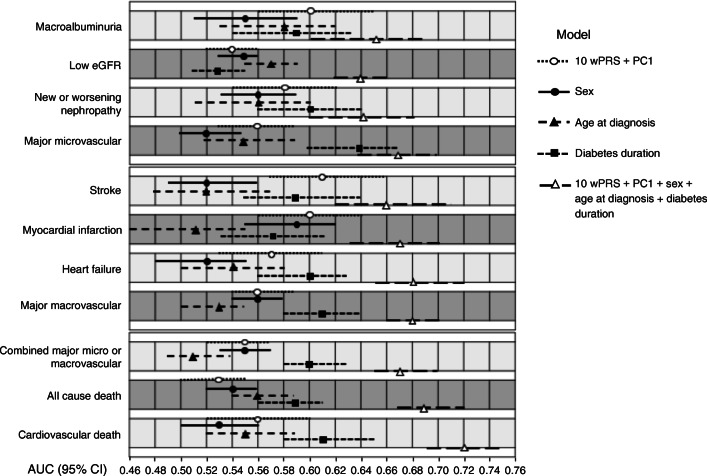
Fig. 3.
Contribution of genomic and non-genomic factors to the risk prediction model. AUCs (95% CI) are shown for incident complications (free of outcome at study entry). White circles indicate AUCs with genomic component 10 wPRS + PC1 only; black circles indicate AUCs with sex alone; black triangles represent AUCs with age at diagnosis alone; black squares are AUCs with diabetes duration alone; white triangles indicate AUCs of the full model. Upper section: microvascular and renal outcomes; middle section: macrovascular and cardiac outcomes; lower section: combined micro- and macrovascular outcomes and death

