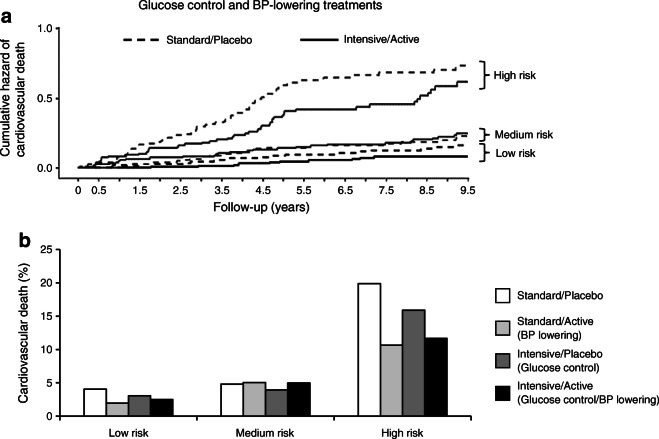
Fig. 5.
Cumulative hazard plots of cardiovascular death stratified by multiPRS strata and glucose and BP-lowering treatments. (a) Adjusted cumulative hazard curves for 9.5 year cardiovascular death by combined active BP and intensive glucose-lowering treatment arms in the high, medium and low multiPRS thirds. The control participants used are normotensive individuals. The effect of BP and glucose-lowering treatment was assessed using HRs and was significant for individuals included in the high-risk group (HR 0.61 [95% CI 0.40, 0.93], p = 0.021 at year 4.5 follow-up of ADVANCE trial, and HR 0.67 [0.47, 0.95], p = 0.023 at year 9.5 follow-up of ADVANCE-ON follow-up). (b) Frequency (%) of cardiovascular death in low, medium and high multiPRS risk strata and risk reduction by treatment arms in ADVANCE. The four treatment arms are Standard/Placebo, Standard/Active for BP lowering, Intensive/Placebo for glucose control and Intensive/Active for glucose control and BP lowering, respectively. The NNT is 64, p = 0.28 in the low multiPRS third compared with NNT 12, p = 0.0062 in the high-risk group for the combined therapy in ADVANCE

