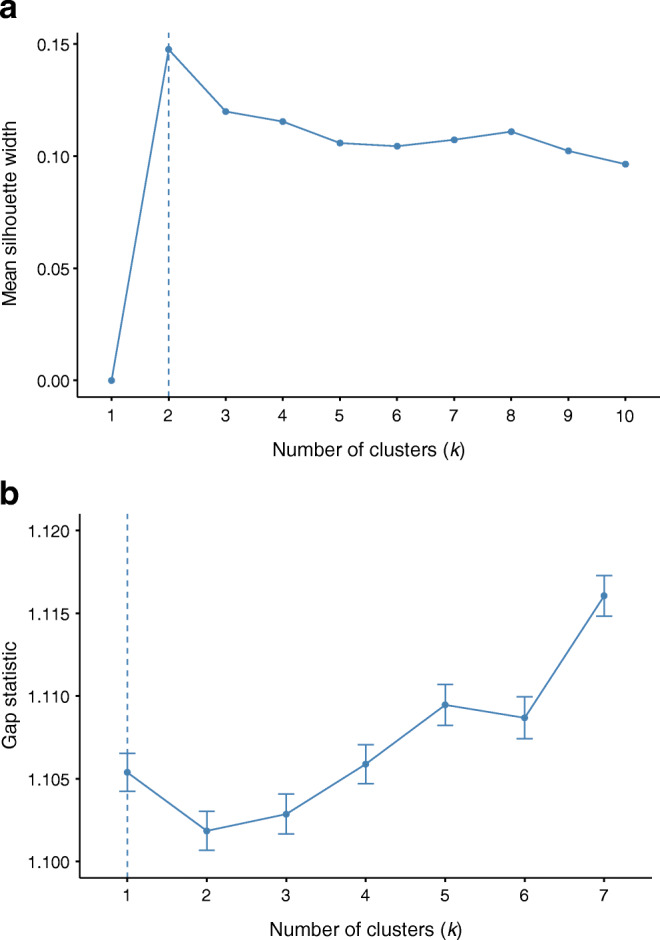
Fig. 2.

Silhouette method on sampled dataset (a) and Gap statistics on sampled dataset (b). (a) The silhouette method was performed on a sampled dataset consisting of 20,000 observations. The vertical dashed line indicates that the mean silhouette width was highest for k equal to 2 in this study. The Silhouette method is used to evaluate how well each person lies within their cluster and to estimate the mean distance between clusters. The silhouette coefficients range from −1 to +1, where a high value indicates that the individuals are well matched to their own clusters and poorly matched to neighbouring clusters. (b) Gap statistics were performed on a sampled dataset consisting of 20,000 observations, using 50 bootstrap samples. The gap statistic compares the total intra-cluster variation between observed data and reference data with a random uniform distribution (a distribution with no obvious clustering) for different values of k, the number of clusters. The optimal value of k is interpreted as the one that maximises the gap, in the figure indicated by the vertical dashed line
