
Figure 3.
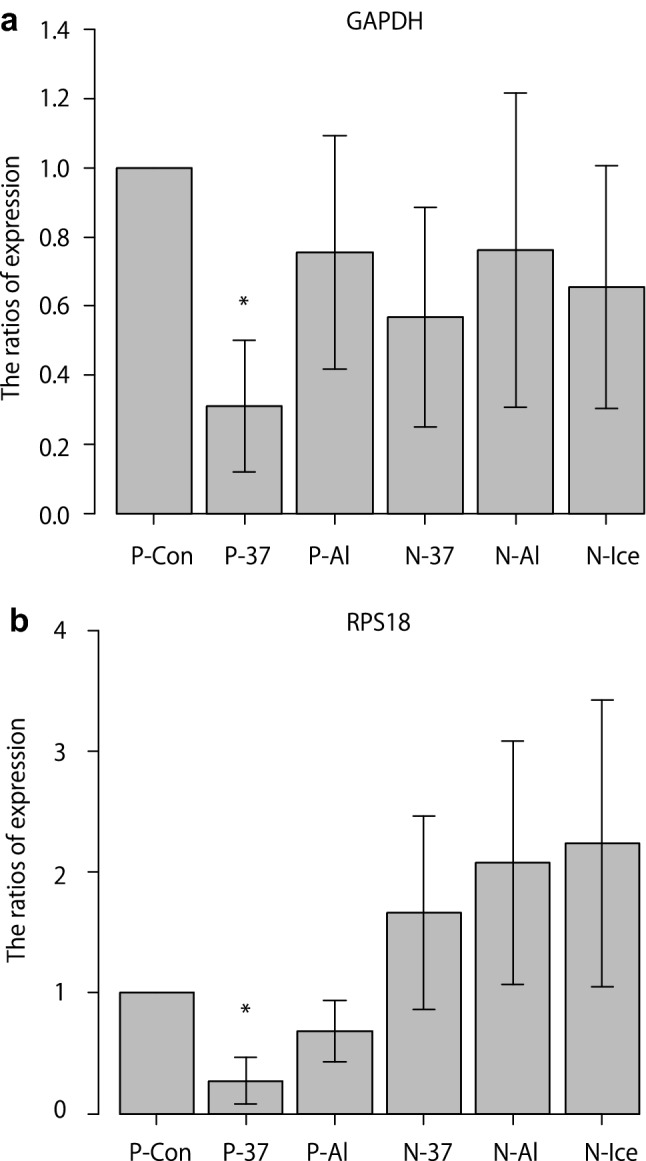
Comparison of GAPDH and RPS18 expression in RNA isolated from whole blood samples using six different protocols. (a,b) Data are shown for each sample as mean ± standard deviation (n = 7). (a) *p < 0.05 for P-Con versus P-37 and P-37 versus P-Al (repeated-measures analysis of variance with Bonferroni correction). (b) *p < 0.05 for P-Con versus P-37, P-37 versus N-37, and P-37 versus N-Al (repeated-measures analysis of variance with Bonferroni correction). GAPDH glyceraldehyde 3-phosphate dehydrogenase, RPS18 ribosomal protein S18. The images were created using EZR software version 1.54 (http://www.jichi.ac.jp/saitama-sct/SaitamaHP.files/statmedEN.html), Microsoft Excel 2016 MSO (16.0.14131.20278) 32 bit (https://www.microsoft.com/) and Adobe Illustrator CS5 (https://www.adobe.com/).