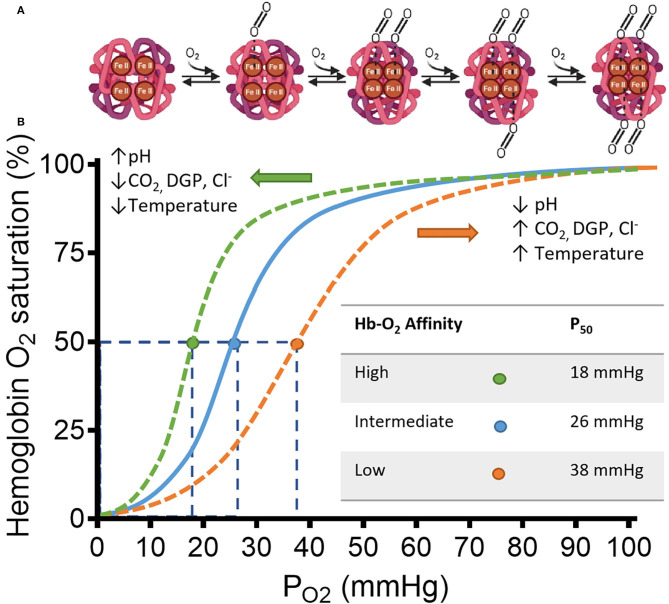
Figure 1.
Schematic representation of hemoglobin (Hb) and its affinity for Oxygen (O2) in a classic HB-O2 dissociation curve. (A) The Hb structure has two α- and two β-subunits (light and dark magenta, respectively). Each subunit has a heme residue with Fe+2. Transition from deoxy-Hb (“T” state) to oxy-Hb (“R” state) is represented from left to right. Increasing concentrations of O2, changes the structure of hemoglobin to “R” state allowing the cooperative binding of O2. The transition starts by displacement of H2O from the distal region of the binding pocket by a diatomic ligand such as O2. Once the O2 is sequestered at the distal pocket, the proximity with Fe+2 from the heme group allows O2 to bind covalently. Finally, minor electrostatic rearrangements stabilize the new conformation. After this process, the hydrophobic interactions between the other subunits are weakened facilitating bonding between O2 and the unliganded hemes of the same Hb. (B) Hb saturation curve shows changes in affinity for O2 by multiple factors. Under low pH, the C-terminal residues of the globin β-chains are protonated, which facilitates O2 release from heme by shifting the Hb conformation to the low-affinity T-state (12). Similarly, CO2, Cl−, and 2,3-diphoglycerate DPG, bind to multiple cationic residues on the N- and C-termini of the α- and β-chains that ultimately stabilizes the T-state conformation of Hb (13, 14). The specific allosteric shift is represented by the orange dashed line displaced to the right from the continuous blue line. The orange dot shows a reduced affinity observed by a higher P50-value. The opposite is also true, where the allosteric shift to the left by the above-mentioned factors (represented by the green dashed line) increases the affinity of O2 for Hb, shown by the green dot and the smaller P50-value. Adapted from Storz (15).

