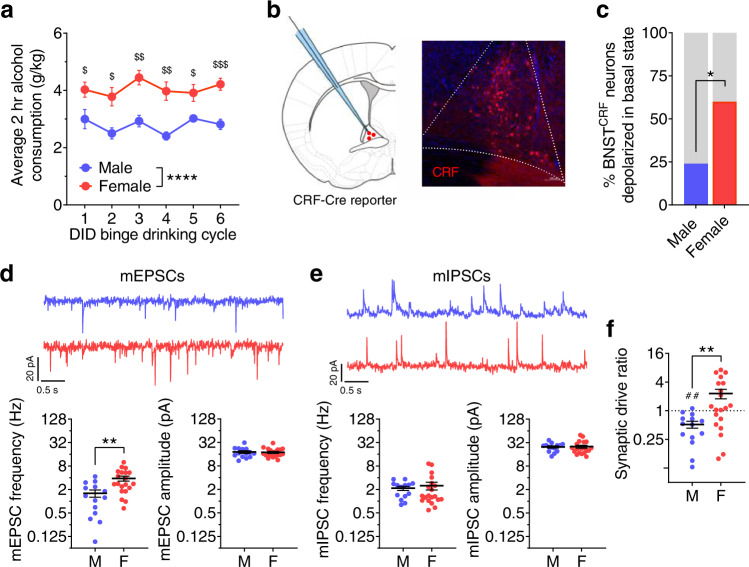
Fig. 1. Females display higher binge alcohol drinking and have greater BNSTCRF neuron excitation.
a Average 2-h alcohol consumption across cycles of the Drinking in the dark (DID) binge drinking paradigm (N’s = 10 M, 10F). 2xRM-ANOVA: main effect of sex (F1,18 = 34.81, ****P < 0.0001) and no effect of cycle (P = 0.101) or interaction (P = 0.531); post hoc two-tailed t-tests with Holm-Sidak corrections within-cycle show sex differences on all cycles (C1: t17 = 2.41, $P = 0.032; C2: t14.8 = 3.41, $P = 0.012; C3: t17.1 = 4.69, $$P = 0.001 C4: t12.4 = 4.69, $$P = 0.003; C5: t11.3 = 2.83, $P = 0.030; C6: t17.7 = 5.06, $$$P = 0.0005). b, Schematic of whole-cell patch-clamp recordings of BNSTCRF neurons (left) and representative image of a coronal BNST section (right) from a CRF-Cre × Ai9 reporter mouse. c Proportion of BNSTCRF neurons active in their basal state (Fisher’s exact test *P = 0.021, N’s = 13 M, 25 cells; 11 F, 25 cells). d–f Spontaneous (miniature) excitatory and inhibitory postsynaptic currents (mEPSCs and mIPSCs) in the presence of TTX (1 µM) to block action potential-dependent synaptic transmission in BNSTCRF neurons (N’s = 3 M, 14 cells; 5 F, 21 cells), compared between males and females using two-tailed unpaired t-tests. d Top: representative traces of mEPSCs in BNSTCRF neurons of males (blue, above) and females (red, below). Bottom: mEPSC frequency (left, t32 = 3.44, **P = 0.002) and mEPSC amplitude (right, t32 = 0.06, P = 0.956). e Top: representative traces of mIPSCs. Bottom: mIPSC frequency (left, t32 = 0.32, P = 0.753) and mIPSC amplitude (t32 = 0.13, P = 0.901). f, Synaptic drive ratio, calculated as (mEPSC frequency × amplitude)/(mIPSC frequency × amplitude) is higher in females than males (t32 = 2.99, **P = 0.005) and below 1.0 in males (one-sample t-test: t13 = 4.06, ##P = 0.001) but not females (one-sample t-test: t19 = 0.83, P = 0.415). Data are presented as mean values ± SEM.

