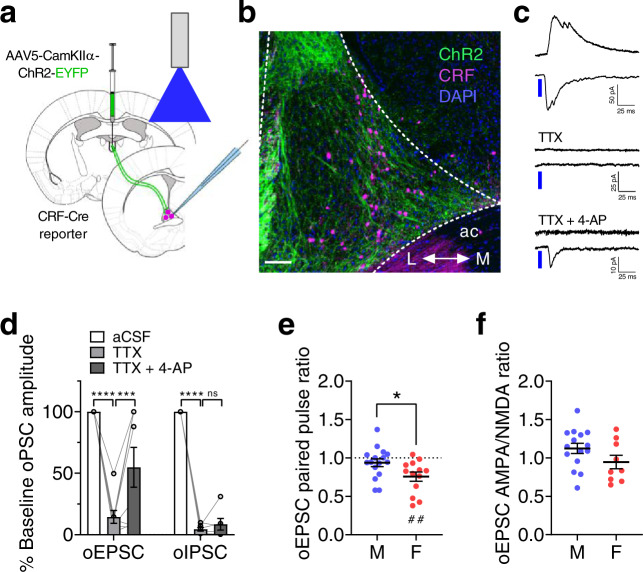
Fig. 3. The PVT-BNST projection provides polysynaptic inhibition onto BNSTCRF neurons.
a–b Approach for slice recordings in BNSTCRF neurons during optical excitation of ChR2 in PVT axon terminals (a) and representative coronal image of the dorsal BNST (b); ac = anterior commissure, L = lateral, M = medial. Scale bar = 100 μM. Similar images were used to visually confirm ChR2 expression in each round of surgery and produced similar results. c–d Representative traces (c) and quantification (d) of time-locked optically-evoked EPSCs (oEPSCs) and IPSCs (oIPSCs) in BNSTCRF neurons in response to 2 ms pulses of blue LED at baseline, in the presence of tetrodotoxin (TTX, 1 μM), and with the addition of 4-aminopyridine (4-AP, 100 μM). oEPSCs: 1xRM-ANOVA effect of drug (F2,14 = 22.6, P < 0.0001), post hoc two-tailed paired t-tests with Holm-Sidak corrections (aCSF vs. TTX: t14 = 6.71, ****P < 0.0001; TTX vs. TTX + 4-AP: t14 = 3.16, **P = 0.007); N = 5 mice, 8 cells. oIPSCs: 1xRM-ANOVA effect of the drug (F2,10 = 429.0, P < 0.0001), post hoc two-tailed paired t-tests with Holm-Sidak corrections (aCSF vs. TTX: t10 = 25.90, ****P < 0.0001; TTX vs. TTX + 4-AP: t10 = 1.10, P = 0.299); N = 4 mice, 6 cells. e Paired pulse ratio of pharmacologically-isolated oEPSCs is lower in females than males (two-tailed unpaired t-test: t27 = 2.33, *P = 0.028) and below 1 in females (one-sample t-test: t12 = 4.07, ##P = 0.002) but not males (one-sample t-test: t15 = 2.33, P = 0.235). N’s = 4 M, 16 cells; 3 F, 13 cells. f oEPSC AMPA/NMDA ratios between sexes (two-tailed unpaired t-test: t22 = 1.61, P = 0.121). N’s = 4 M, 15 cells; 3 F, 9 cells. Data are presented as mean values ± SEM.

