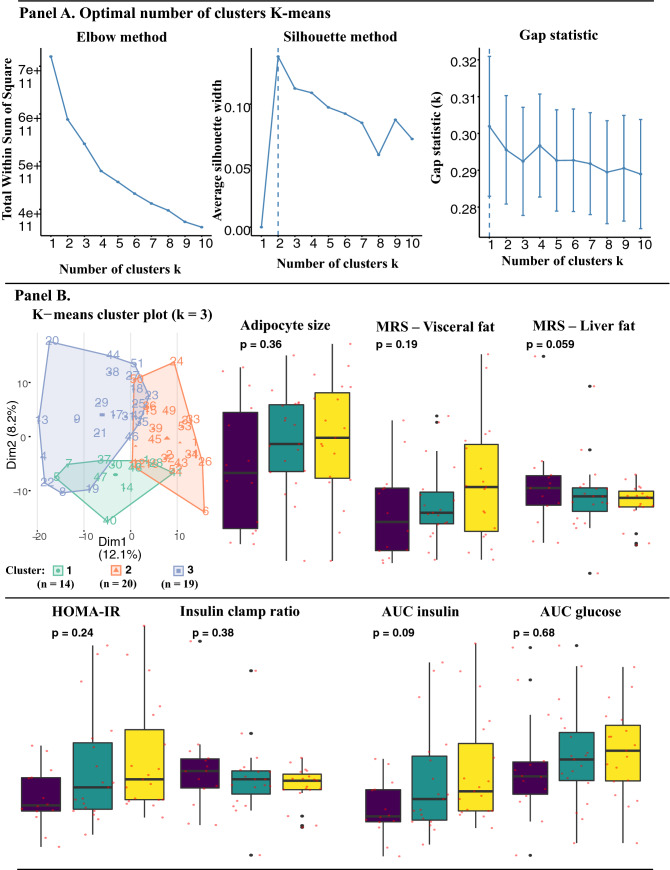
Figure 4.
Cluster analysis including validation methods, distribution measures with ANOVA for adipocyte size, magnetic spectroscopy for visceral and ectopic liver fat, and insulin- and glucometabolic predictors. K-means clustering with validation methods revealed that 2 to 3 unique clusters were optimal for this dataset. Thereafter, mean values for predictors of interest in this study was examined and ANOVA was performed to identify significant differences in mean values.

