
Figure 4. The transmembrane region of the EMC contains a client-binding pocket.
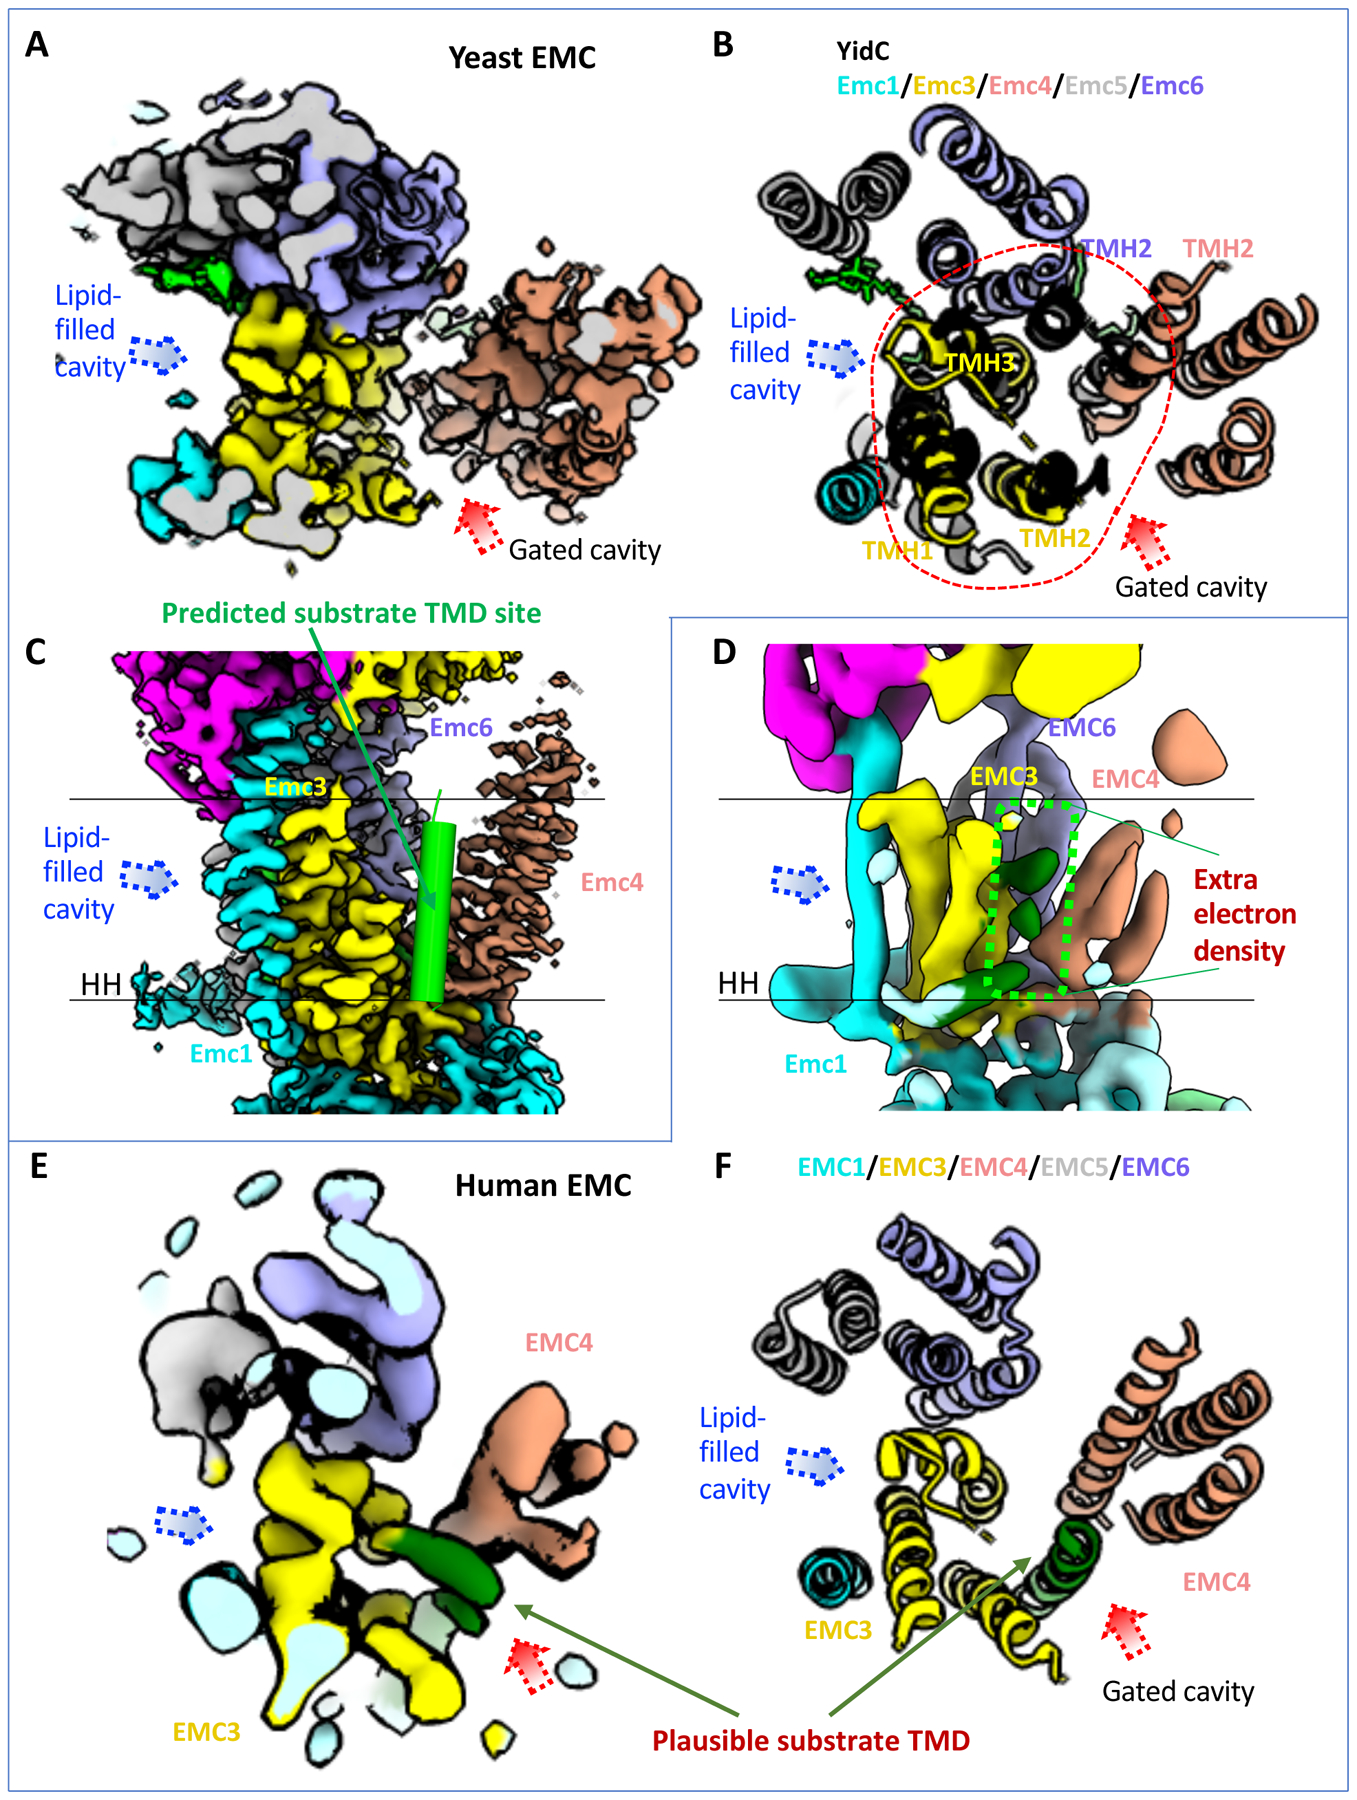
(A) Cryo-EM map of transmembrane domain of the yeast EMC in a top (cytosolic) view (EMD-21587). Dotted red and blue arrowheads mark two large, potential client TMD-binding cavities. (B) Superposition of the YidC structure (PDB ID 5Y83) in black cartoon and the transmembrane domain of yeast EMC (PDB ID 6WB9) in a top (cytosolic) view. Red dashes encircle the five EMC α-helices aligned with YidC. The putative client TMD position in EMC is shown by the red arrowhead, which is based on previously reported EM structure of a YidC–ribosome complex [4]. (C) A front view of the yeast EMC transmembrane region (EMD-21587). The green cylinder represents a client TMD located between TMH2 of Emc3 and TMH2 of Emc4 in the putative client-binding pocket. (D) A front view of the human EMC transmembrane region (EMD-11058). Two parallel black lines mark the lipid bilayer position. The dashed green rectangle highlights several density peaks in the putative client-binding pocket. The label “HH” in (C-D) refers to the amphipathic horizontal helix of EMC1. (E-F) Top view of the transmembrane region of the human EMC 3D map (EMD-11058, panel E) and atomic model (PDB ID 6Z3W, panel F), showing it in the same orientation and region as in the yeast EMC in (panels A-B). The rod-like weak density was originally assigned to the TMD of EMC7. This density is located at the position of the predicted substrate TMD and is likely from a co-purified endogenous substrate.